NBA clutch statistics

Song: iiO – Rapture (Deep Dish Space Remix)
Notebook: https://github.com/csdurfee/csdurfee.github.io/blob/main/notebooks/nba-clutch-stats.ipynb
This week, I'm discussing team clutch statistics from nba.com.
Clutchness
A basketball player who tends to make good plays in high-pressure situations is known as being "clutch". When the game is on the line, who do you want taking the last shot, or guarding the other team's best player?
Like a lot of other psychological phenomena, I think "clutchness" is mostly something we notice in retrospect. It's easy to remember when our favorite players "came up clutch". It's harder to remember times when they didn't, and impossible to accurately decide whether a player is objectively clutcher than average or not based on our subjective memories, rather than using statistics.
With the hot hand phenomenon, we notice a player "can't miss" after they've already made a few shots in a row, and then they make another one. Although I've shown that the opposite of the hot hand exists in the NBA, I can't argue against the feeling that a player is on fire, or can get hot. I feel it, too. Like clutchness, some players just seem to have it, and some don't. But I think it's mostly an artifact of how we remember things.
This is perhaps reflected in the NBA's Clutch Player of the Year award. Last year, it was won by Jalen Brunson, who is a player I think NBA fans would consider pretty clutch (at least on offense). But statistically, besides scoring a lot, Brunson wasn't one of the best players in clutch time last season. His team, the Knicks, only went 17-11 (60.7%) in clutch games, which was almost exactly matched their overall record, 50-32 (61%). They won as many games in the clutch as we'd expect them to. But Brunson feels like a clutch guy. It's an award based on vibes, rather than objective facts.
This week, I'm examining team level NBA clutch statistics. The NBA formally defines clutch time as the last 5 minutes of a game, when the score is within 5 points. Obviously some threshold had to be chosen, but I wonder if a species with 4 fingers on each hand would have set the threshold at the last 4 minutes, when the game is within 4 points.
Conditional probabilities and Christmas lights
It's easy to find statistical correlations that seem important or profound, but are actually meaningless once the mess of conditional probabilities are untangled, like a box of old Christmas lights, and the right baseline is established.
An example I came across recently involves bets on NFL point totals, where you can bet on whether the total number of points scored by both teams is higher or lower than a certain number. Let's say an NFL game is a blowout -- one team wins by more than 20 points. 55% of the time, when a game is a blowout, the bet on the over wins. Is this an interesting correlation?
We might take the 55% as evidence of the rubber band effect, where teams that are ahead by a large margin tend to play with less intensity on defense, allowing the other team to score garbage time points -- scores that don't affect the outcome of the game, but make the final score look more competitive than the game actually was. It's possible the rubber band effect makes the over point total more likely to win, right?
Nope! There's a hidden conditional. In order for one team to win by at least 20 points, at least one team has to score 20 points first. In the set of games where one team scored at least 20, the over wins 60% of the time. So the game being a blowout is associated with a lower probability of the over winning, when considering those games against their true peers.
Clutch time is mediocrity time
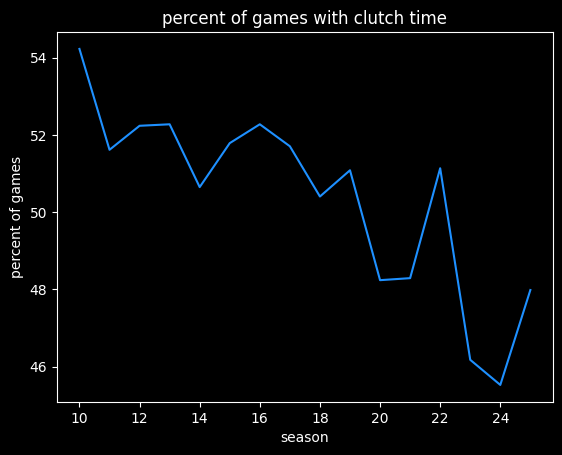
Clutch games are pretty common, around half of all NBA contests. That's stayed pretty consistent from year to year, though perhaps the rate is going down over time:
Here's a plot of each teams' winning percentage versus percentage of games played in the clutch:
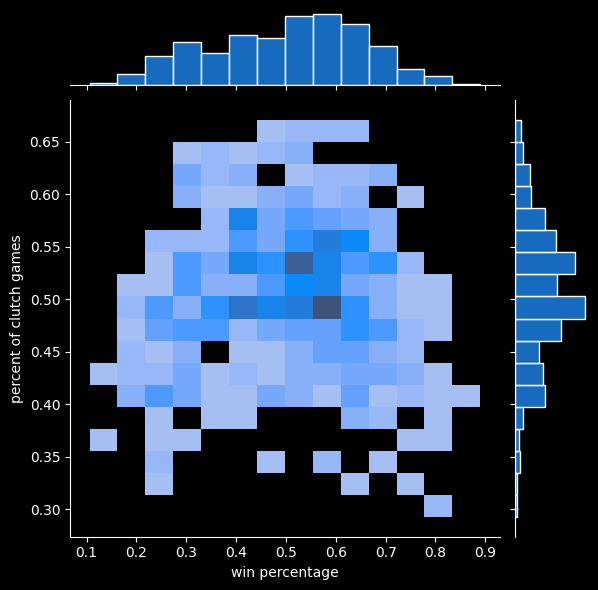
In order for an NBA game to have clutch time, it has to be a close game in the first place. Really good teams and really bad teams will be involved in fewer clutch games than teams in the middle, because they're more likely to be winning or losing by a lot.
Clutch is sort of a backhanded compliment. Houston is known as "Clutch City" because of the 1993 Rockets. (I don't know why a rocket would need a clutch, unless it is some sort of steampunk apparatus.) The team blew multiple big leads in the Finals, and just barely won the championship in 7 games. And it's unlikely the Rockets would have beaten the Bulls, if Michael Jordan hadn't been playing baseball that season. Houston only became "Clutch City" due to luck and the team's inability to finish games off. Is it really clutch to dig yourself out of a hole that you created?
There's a similar thing with NFL football. Brett Favre and John Elway are known as clutch quarterbacks because they led a lot of game winning drives. But many times, they were only in the position to have to win the game on the last drive because they threw 3 interceptions earlier.
Do especially clutch teams exist?
Teams' records in clutch situations should be close to their record overall. Here's a plot of win percentage in clutch vs. non-clutch games.
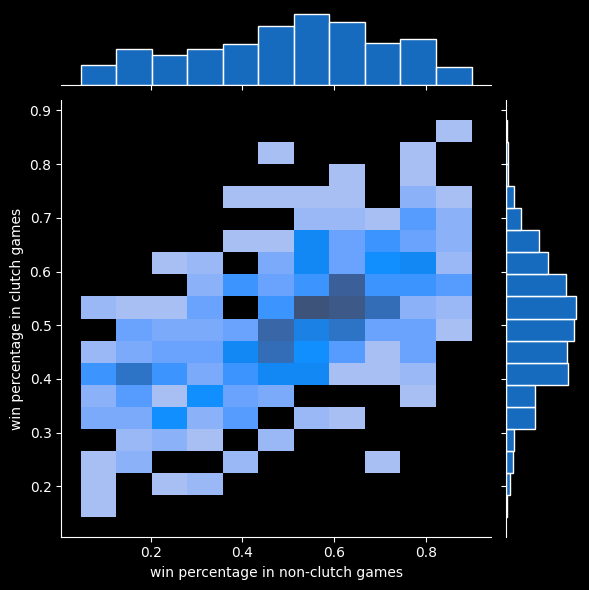
Teams that are bad tend to be bad in both clutch and non-clutch games. Teams that are good tend to be good in both. Most teams are mediocre at both.
Offense and Defensive Ratings in the clutch
Offensive and Defensive Ratings are a measure of the average number of points scored/given up by a team per 100 possessions.
There is a clear effect on these numbers in clutch time. Offensive and defensive ratings are both about 2.5 points lower in the final minutes of close games. Either offenses are worse, or defenses are better, or a bit of both. But it's a little bit harder for teams to score.
What would constitute evidence that a team actually has a special ability to win games in the clutch, versus just doing what they always do?
I decided to look at teams that are better on both offense and defense in clutch situations. For Offensive Rating, bigger is better; for Defensive Rating, smaller is better. These are the teams in the upper left quadrant of this graph:
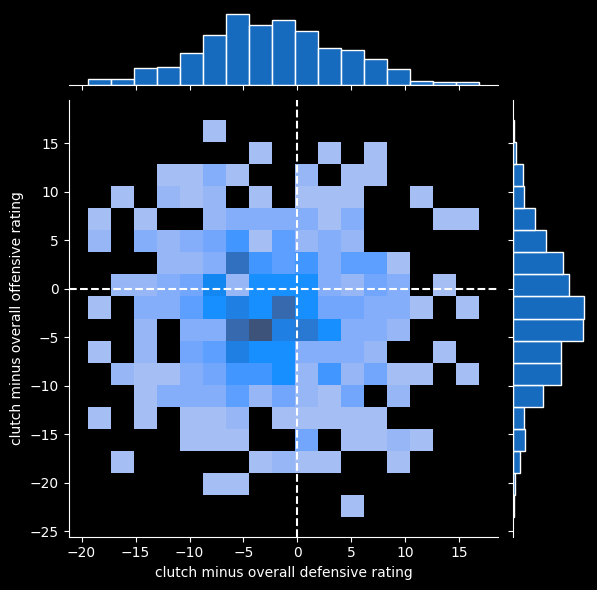
I restricted to teams that were at least 3 points better on both offense and defense. 51 teams since 2010 have met that threshold.
That set includes some great teams, such as the 2015 Golden State Warriors, who went a record 73-9 in the regular season, and 3 that won the NBA championship (2010 Mavericks, 2012 Miami Heat, and 2014 Warriors).
But the set also includes some truly bad teams, like the 2010 Cleveland Cavaliers, who went 19-63, 2013 Philadelphia 76ers, who also went 19-63, and the 2023 Charlotte Hornets, who went 21-61. 11 of 51 teams on the list didn't even make the playoffs, and 10 of them lost more games than they won.
The 40 clutch teams that made the playoffs won an average of 5.8 playoff games, versus 5.2 for all teams that made the playoffs. So these clutch teams do a little better in the postseason, but it's not a massive bump.
It's possible coaching makes a difference. There are four teams coached by Rick Carlisle on the list (2010, 2014, 2015 Mavericks; 2024 Pacers). Or perhaps certain players are significant. There are also four teams starring James Harden (2013, 2017 and 2019 Rockets; 2023 LA Clippers).
While being clutch is a positive signal, but not as strong as being a good team overall. The last 15 NBA champions average a rank of 5.3 in clutch win percentage, but 2.6 in overall win percentage on the season. Except for the 2020 Milwaukee Bucks, every NBA champion has been in the top 4 for regular season winning percentage over that stretch.
Because it's a smaller sample, performance in clutch games really should be a less accurate predictor of team success in the playoffs than their overall record in the regular season, and it is.
More on NBA clutch stats next week.