The final word on the hot hand (for now)
(Notebooks and other code available at: https://github.com/csdurfee/hot_hand.)
Last time, we found that there are many players like LeBron, where their FG% is higher when they've missed most of their last 5 shots than when they've made most of them. However, most players don't have enough attempts when they've gone 0 or 5 out of their last 5 for a good statistical analysis.
So instead I will be looking at a binary split -- I will call a player cold when they've made 0, 1 or 2 of their last 5 shots, and hot when they've made 3, 4 or 5 of their last 5. Most players have a FG% between 40 and 60%, so this nicely splits them into times when they're shooting better than average versus worse than average.
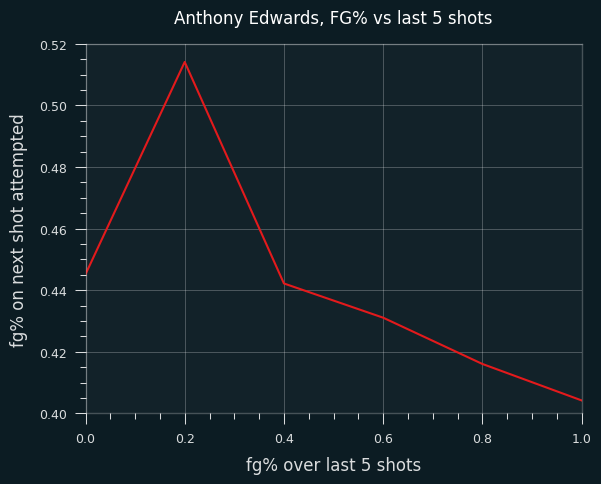
Anthony Edwards
Anthony Edwards ("Ant") is particularly unstreaky for a young player. He's only completed 5 seasons in the league, but has the 5th biggest z score of the last 20 years. He could definitely catch LeBron someday.
Ant has the LeBron-like pattern of FG% trending downward when he's hot. He doesn't have anywhere near the volume of LeBron, so the spike at 20% (1/5) might just be noise. But overall, he shoots worse when he's been shooting well.
The trend appears to be due to shot selection. He takes far more above the break 3 pointers when he's hot than when he's cold. The additional 3 point attempts come at the expense of shots in the restricted area.
Here are the changes in tendencies:
| BASIC_ZONE            |   hot |   cold |   diff |
|:----------------------|------:|-------:|-------:|
| Above the Break 3     |  41.5 |   31.7 |    9.8 |
| Corner 3              |   3.6 |    4.8 |   -1.2 |
| In The Paint (Non-RA) |  13.4 |   14.6 |   -1.1 |
| Mid-Range             |  14.1 |   12.2 |    1.9 |
| Restricted Area       |  27.4 |   36.7 |   -9.4 |
Of course, this would be justified if Ant shot above the break 3's better when he's hot, but he doesn't. He makes 37% of his above the break 3's when he's cold but that drops to 34% when he's hot. So he's trading restricted area shots, with an expected value of .601 * 2 = 1.202 points, for above the break 3's, with an expected value of .34 * 3 = 1.02 points.
Here are the changes in FG percentages. His FG% on corner 3's goes up, but it's on insignificant volume:
| BASIC_ZONE            |   hot |   cold |   diff |
|:----------------------|------:|-------:|-------:|
| Above the Break 3     |  34   |   37.1 |   -3.1 |
| Corner 3              |  45   |   33   |   12   |
| In The Paint (Non-RA) |  40.8 |   34   |    6.8 |
| Mid-Range             |  36.3 |   34.8 |    1.5 |
| Restricted Area       |  60.1 |   65.4 |   -5.2 |
The rest of the league
I looked at league-wide shot selection in hot/cold situations. I restricted to the last 10 seasons, since the rise of the 3 pointer has dramatically changed shot selection. Here are changes in shot selection for all players:
| BASIC_ZONE            |   hot |   cold |   diff |
|:----------------------|------:|-------:|-------:|
| Above the Break 3     |  22.1 |   22.3 |   -0.2 |
| Corner 3              |   6.2 |    7   |   -0.9 |
| In The Paint (Non-RA) |  15.8 |   15.3 |    0.4 |
| Mid-Range             |  25.3 |   23.5 |    1.8 |
| Restricted Area       |  30.7 |   31.8 |   -1.2 |
The mid-range shot is the lowest value shot type, so it's notable that the rate goes up when players are hot. These additional mid ranges come at the expense of Corner 3's and Restricted Area shots, the two most valuable types of shots.
As before, changes in shot selection could be justified if players actually shoot differently based on their last 5 results, but they don't. Here are the changes in shooting percentages (hot minus cold) for all players:
| BASIC_ZONE            |   hot |   cold |   diff |
|:----------------------|------:|-------:|-------:|
| Above the Break 3     |  34.7 |   35   |   -0.3 |
| Corner 3              |  38.4 |   38.9 |   -0.4 |
| In The Paint (Non-RA) |  41.7 |   41.2 |    0.5 |
| Mid-Range             |  39.8 |   40.1 |   -0.3 |
| Restricted Area       |  62.7 |   60.7 |    2   |
For 3 out of 5 shot types, the hot FG percentages are lower than the cold ones. Combined with the changes in shot selection, I think there's evidence that the league as a whole is scoring less efficiently because of the false belief in the hot hand.
The data says that players are essentially trading Restricted Area (.627 * 2 = 1.25 points per shot) and Corner 3 (.384 * 3 = 1.15 points per shot) attempts for Mid-Ranges (.398 * 2 = .796 points per shot) when they think they've got the hot hand. That's clearly bad! If it happens once a game, that's 38 points a year lost, which might be enough to swing a game or two.
The change in restricted area and in the paint (non-RA) FG% is intriguing, but if the hot hand did exist, wouldn't we see it on 3 point or mid-range shots, rather than restricted area shots? The announcer doesn't say "he's heating up" after a guy has made 3 layups in a row, they say it after 3 longer range shots in a row, right?
Higher volume players
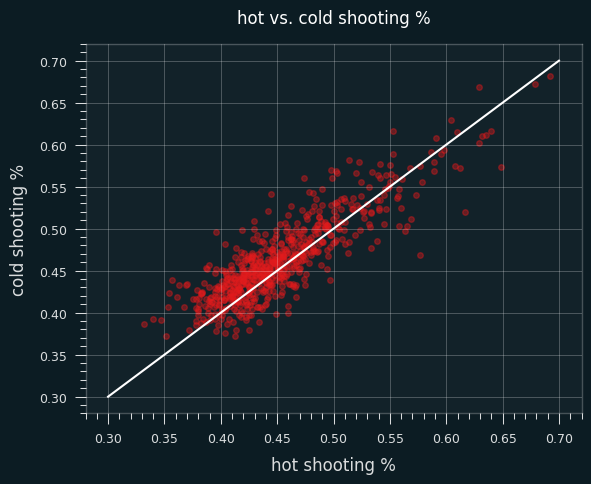
I decided to focus on players with at least 1000 streaks, which leaves 630 players. Collectively, they are responsible for 84% of all shots in the NBA over the last 20 years.
Their FG percentages are, on average, 1% lower when they are hot than when they are cold.
68% of them shoot worse when they're hot than when they're cold, which is a pretty dramatic split.
Here's a plot of the difference between hot and cold FG% versus z-score:
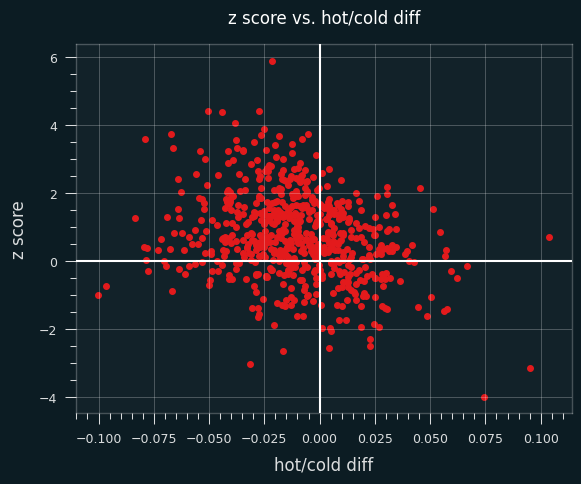
Players with negative values on the x axis shoot better when they're cold, and positive values shoot better when they're hot.
Now, there should be some correlation between z-scores and hot/cold shooting tendency. I've shown simulations where a tendency to shoot better cold produces unstreaky results (skewed towards positive z scores), and better hot will produce streaky results (negative z scores). So there should be more dots in the upper left and bottom right quadrants compared to the other diagonal.
But if players behaved by coin flips, we should see roughly the same number of players with positive and negative z scores, and roughly the same number of players who shoot better when they're hot and better when they're cold.
I simulated all 3.5 million shots by these players, using their career average FG% for every shot. So any streakiness or unstreakiness is going to be totally random. As you can see, the data is much less spread out across both the X and Y axis.
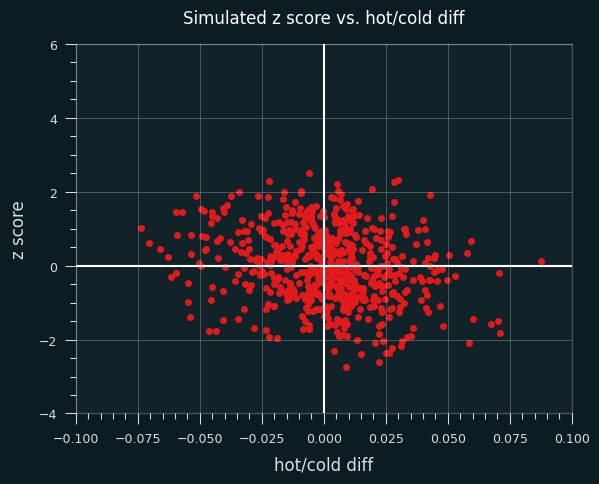
Here are the crosstabs from the simulation:
| better cold | better hot | margin | |
|---|---|---|---|
| positive z | 178 | 135 | 313 |
| negative z | 112 | 210 | 322 |
| margin | 290 | 345 |
As promised, the marginal values are pretty close to one another. That's what happens when "better hot" vs. "better cold" and "positive z" vs. "negative z" are determined purely by chance.
Here are the actual crosstabs. The marginal values are much more imbalanced.
| better cold | better hot | margin | |
|---|---|---|---|
| positive z | 343 | 126 | 469 |
| negative z | 88 | 78 | 166 |
| margin | 431 | 204 |
Things to note:
- 68% of the players shoot better when they're cold.
- 74% of the players have a positive z-score.
- Even among players with a negative z score, the majority of them shoot better when they're cold.
- Even among players that shoot better when they're hot, the majority of them still produce results that are less streaky than expected by chance.
That's all super weird!
As always, these are just general trends. There are 78 players in the "better hot" + "negative z" box, and there should be around 210 players. We can't really say which players are the 130 "missing" players, though.
That's all I've got on the hot hand in the NBA for now. I think I understand it a lot better now, and I hope you do, too.