Free throws and opportunity costs

Song: Delia Derbyshire - Pot Au Feu (1968)
Notebook: https://github.com/csdurfee/csdurfee.github.io/blob/main/notebooks/free-throws.ipynb
The Bucks
There's a lot of buzz around the Milwaukee Bucks right now because their star player has asked to be traded, but I'm gonna stick to the math. The NBA take-industrial complex has got the Giannis situation covered, and I do math better than drama.
I noted a few weeks ago that the Bucks make a surprisingly low number of free throws given that they have a guy with one of the highest free throw rates in the league. They're also bad on defense and end up fouling a lot. That's a bad combination.
As of December 5th, the Bucks are dead last in free throws made (14.4 per game) and 6th worst in free throws made by the other team (21.3 per game). Aren't they essentially having to play every game with a 6.9 point handicap?
Although it's an intuitively simple way of looking at things, it's too simple. Basketball strategy is a series of tradeoffs. There are a lot of "good" numbers -- stats that correlate with more wins -- but it's usually hard to make one good number go up without a bad number going up, or another good number going down, in response.
I'm looking at the last 25 years of team data from nba.com/stats.
Things to remember about free throws
There are complications to analyzing free throws because they're not a fixed quantity. Some fans will see a game where one team gets 20 free throws and the other team gets 35, and take it as evidence that the refs were biased. That's naive -- some players/teams foul more on defense, some players/teams take more foul-worthy shots on on offense, and there's plenty of random variation form game to game. It would be weird if every team committed exactly 30 fouls every single game.
There's seasonality to foul calls as well. On top of formal rule changes, the NBA issues points of emphasis for its officials each year, which change how the rules are interpreted. Certain types of fouls may be emphasized, or de-emphasized, causing the total number of fouls called to go up or down. It's hard to find a formal record of these de facto rule changes, but as a fan, I've seen it several times. For instance, I previously talked about the middle of the 2023 season, where the league told officials to stop calling so many fouls in general, without telling teams or the general public.
There was another shift in the early 2010's where the officials quit calling so many fouls caused by the actions of the shooter rather than the defender. A shooter can shoot in a somewhat artificial way to ensnare the defender's arms. This type of grifting still exists in the league -- looking at you, James Harden -- but the league reduced the number of cheap fouls called in the early 2010's. I couldn't find exactly when they formally made the proclamation, but we can see a big shift in the free throw data after the 2010-11 season.
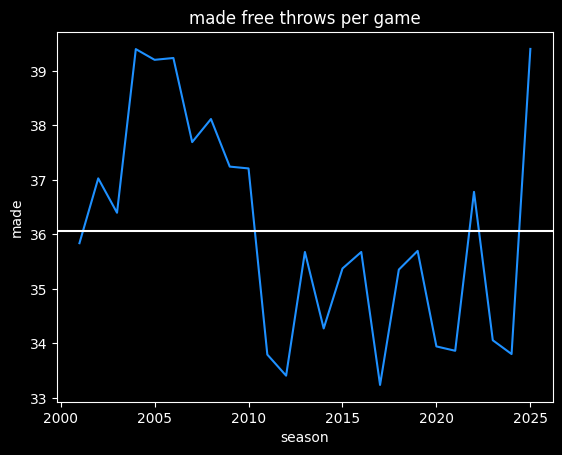
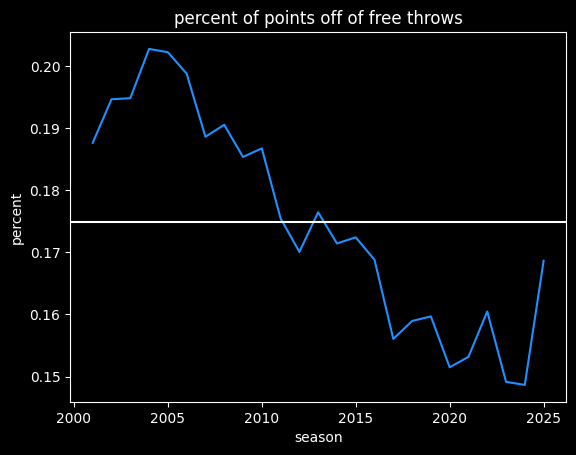
The current season has been more like the NBA from 2004-2010, at over 39 made free throws a game. However, there's a lot more scoring now, so free throws are a smaller percentage of a team's total points:
Do free throw differentials matter?
Of course, there's going to be a lot more variance in the 20 games of this season when compared to a full 82 games.
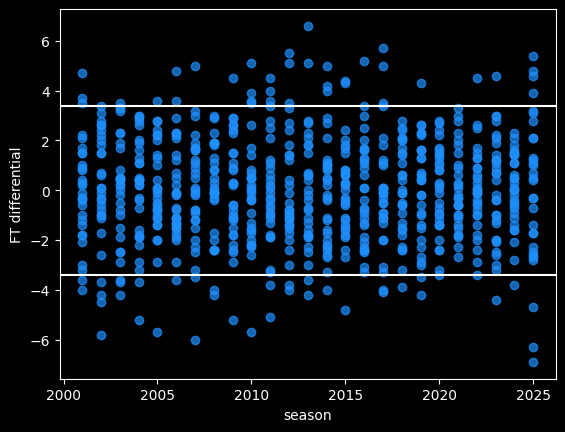
The Bucks' free throw differential of -6.9 (not nice) would be by far the worst of the last 25 years, if it held for the whole season. The Celtics' current differential of -6.3 also stands out.
90% of NBA seasons are between the two white lines. We'd expect there to be 3 outliers by the end of the season, instead of 7.
Some of the differential is due to chance. We should charitably assume that referees make random errors when calling or not calling fouls. Refs can make both Type I errors (fouls they shouldn't have called) and Type II errors (fouls they should have called and missed). Some teams will get called for more fouls than other teams, due to randomness, rather than conspiracy. Over a larger sample size, the refereeing luck will even out.
Free throw differential is positively correlated with winning.
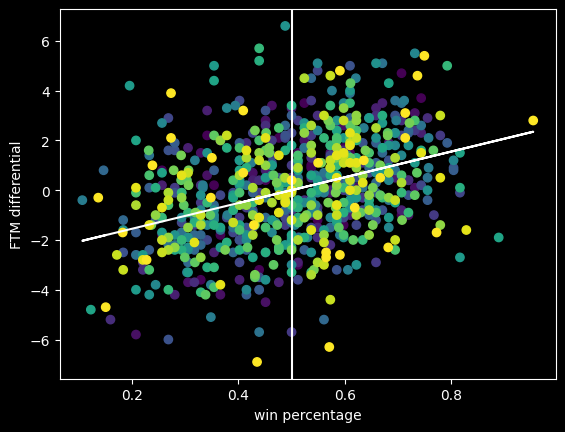
The diagonal line is the overall trendline. Even though it's a positive trend, the teams with some of the biggest positive and negative differentials are close to .500 win percentage. This is a good example of why it's important to visualize data, not just look at the correlation. The bigger picture shows it's good to have a positive free throw point differential, but not a magic ticket to winning.
Do referees try to keep fouls roughly even?
It's possible referees have an unconscious bias towards calling an even number of fouls on both teams. There's certainly a correlation between more free throws made and more free throws given up to the other team.
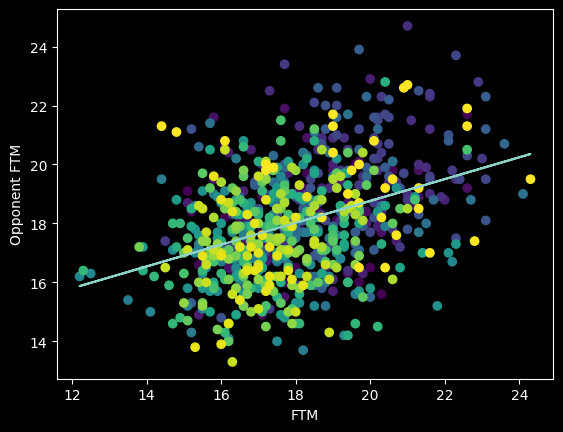
However, this overall picture is misleading. The number of fouls called per game goes up and down season-to-season based on rule changes and points of emphasis. So from year to year, the center of all the dots should move up and down along the diagonal line FTM=Opponent FTM. We should expect a positive correlation overall that isn't necessarily there in the individual seasons -- an example of Simpson's paradox.
Here's an animation of the correlations year-by-year:
A lot of seasons, the trendline is basically flat. But plotting correlations year by year, there are a lot more positive years than negative.
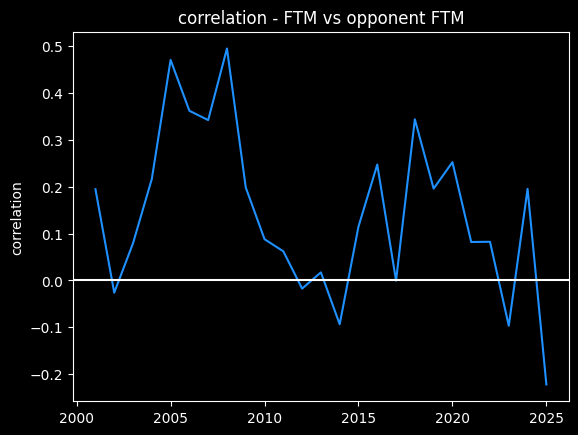
So I do think it's possible that refs call more fouls on teams that get fouled a lot, a conscious or subconscious bias towards fairness. Or perhaps, teams that play physical on offense also tend to play physical on defense as well. We'd need to look at individual games -- we're not going to see evidence of that in the yearly averages.
Basketball strategy and opportunity cost
The opponent's number of free throws made has a higher correlation with winning percentage (r=-0.260) than a team's number of free throws made (r=0.153). If it were possible to make such a binary tradeoff, the Bucks would be better off trying to foul the other team less, rather than trying to draw more fouls. That's especially true given the Bucks are the best 3 point shooting team in the league -- drawing more fouls would mean fewer 3 point attempts. They have the 2nd highest eFG%, so they're already making the most of their shot attempts.
Why isn't their offense better overall? One big reason is their offensive rebounding rate is the lowest in the league. They score the fewest 2nd chance points in the league, at only 10.5 2nd chance points a game, versus 18 a game for the top teams. Does that mean another de facto 7 point handicap?
Not necessarily, because offensive rebounding rate is a schematic choice. Do the bigs try to get the rebound (crash the boards), or do they try to hustle back and play defense? Teams coached by Doc Rivers tend to have low offensive rebounding rates. The "Lob City" Clippers were a great rebounding team, yet in their heyday from 2014-2018, they were 21st, 28th, 29th, and 24th in offensive rebounding, so it's not surprising the Bucks have that same tendency.
The Thunder have the 3rd fewest second chance points, so a team can definitely be elite and not get a lot of offensive rebounds. But unlike the Thunder, the Bucks are bad on defense (22nd in defensive rating) and foul way too much, so they're not in a good place to make defense their identity. If this were NBA 2K, I'd probably move the "crash the boards" slider to the left for the Bucks and see what happens, because the Bucks are closer to being elite on the offensive end. There's more strength to build on.
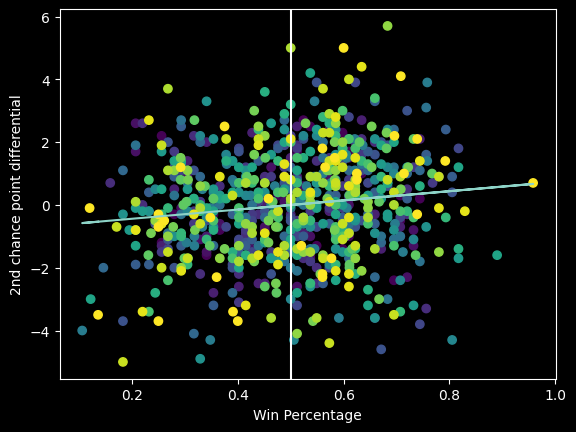
There is only a very slight positive correlation between 2nd chance point differential and winning percentage. It's a bad predictor of team success.
The Nets are fun... for now
The Brooklyn Nets had a bunch of draft picks and cap space going into this offseason, and they didn't seem to maximize those resources. A lot of people didn't like the trade they made for Michael Porter Jr., which got the Denver Nuggets out of salary cap hell in exchange for a fairly small return. The Nets were the only team in the league with the financial flexibility to take on bad contracts in trades, so they probably could have gotten more.
They also didn't trade any of the five first round picks they accumulated in this year's draft. Why didn't they trade some of them for future picks? The conventional wisdom is that teams shouldn't try to develop too many rookies at once. What's a team supposed to do with five rookies (two of whom are teenagers), with some overlap in the positions they play?
Well for one thing, they're supposed to be terrible. The Nets have been bottoming out for a few seasons, and I doubt that will stop this season. Catch them in the next few weeks while they're sort of trying to win games, if you're curious. They've won 3 out of their last 4 games and they've been entertaining.
They were fun for a few weeks at this point in the season last year, too. The front office will probably try to trade away their best players over the next couple of months to keep them from being too good. But right now, MPJ is a good stats/bad team All-Star, Nic Claxton is solid as always, rookie Danny Wolf is already a fan favorite, and a couple other rookies show promise.
As fun as they are, I'm not encouraged by the Nets' approach to rebuilding. I'm always a lot more concerned with process than outcomes, because the process can be controlled. It seems like their idea is that if they draft enough first rounders, inevitably some of them will be good. It's treating players like lotto scratch tickets -- players are inherently winners or losers, and it's the front office's job to play the percentages and get as many picks as possible.
That's bad process to me. Players are more like a packet of seeds. The final result is heavily dependent on how and where they are grown. The same seed grown in two different environments can give two very different results. Some seeds are better than others, but without the right environment, even the best seeds won't grow to their maximum potential. I don't know if they have the culture and support system to develop their five rookies. It will be a few years before we'll see what sort of trees they're growing in Brooklyn.
The Mathletix Bajillion, week whatever
As usual, one set of NFL picks is algorithmic, the other is random.
Mathletix won the week, with a total record of 6-4 versus the Ringer's 10-15 record (note: their website incorrectly lists The Handicapos as going 5-0 when they actually went 4-1. I'm petty enough to notice, but not petty enough to email them about it.)
The Ringer currently has 3 teams at 33-37 and 2 teams at 31-39, for a cumulative record of 161-189 (46.0% winning rate). Of course, some of the Ringer's picks contradict each other -- one Ringer team taking the home team, and another taking the away team on the same game. Removing the bets where Ringer teams contradicted each other would just make things worse, though, because taking both sides of a bet has a winning percentage of 50%, which is better than the Ringer's overall win rate.
Someone taking the opposite of every one of the Ringer experts' picks would be up 11.9 units on the year, for a +3.4% rate of return. There's only a 6.7% chance of getting results that bad by flipping a coin.
As I've written about before, I don't think that makes them bad as far as gambling experts go. Rather, I believe everything they know about football has already been incorporated into the line, so their knowledge is kind of a curse -- they're overvaluing information that the market has already absorbed, so they end up losing more than 50% of the time.
Lines taken Wednesday morning
The Neil McAul-Stars
last week: 4-1, +304
Overall: 15-10, +480
line shopping: +80
- CIN +2.5 -101 (lowvig)
- NYG -2 -110 (hard rock)
- MIA +3.5 -105 (lowvig)
- BUF PK -110 (lowvig)
- NYJ +13.5 -105 (prophetX)
The Vincent Hand-Eggs
last week: 2-3, -108
Overall: 9-15-1, -671
line shopping: +79
- PHI -11.5 -105 (lowvig)
- DET +6 -105 (lowvig)
- WAS +2.5 +105 (prophetX)
- KC -4.5 -109 (prophetX)
- CIN +2.5 -101 (lowvig)