Overs, money lines, and pigeonholes

Song: Pigeonhed, "Glory Bound" (Dave Ruffy Remix)
Code: https://github.com/csdurfee/scrape_yahoo_odds/
A little crowd wisdom
Last week, we saw that for NBA spread bets, the more popular side wins 49.2% of the time. This matches what I've shown before -- the public is generally worse than a coin flip when betting on NBA basketball.
This week, I have some good news. There are some types of bets on the NBA where the public do a little better than expected. Not enough to make money, but better than picking bets by flipping a coin.
Money line bets and rationality
Last time, I looked at money line bets and showed that there is a bias against slight to heavy underdogs, and a possible bias against very heavy favorites. There's a lot I didn't get to, though. What kind of money line bets do the public prefer?
The public takes the home team 63% of the time, which is a little high given the home team wins 55% of games. The public also takes the money line favorite in 96% (4656/4839) of NBA games.
Is that rational or not? We know that favorites are a slightly better deal than underdogs on the money line, so in one sense it is. If someone offered you a free money line bet on the NBA, you should probably pick the favorite. The expected value is less bad than the underdog, so it's a better choice in the long run, and your chances of making some money on the bet are much higher, so it's perhaps a better choice as a single bet as well.
A gambler taking half favorites and half underdogs has a chance at winning 100% of their bets, but someone taking a highly imbalanced number of favorites (or underdogs) will have a whole lot of guaranteed losses. The gambler might correctly pick every single favorite, but close to half of their bets on favorites are still going to be losses.
Getting pigeonholed
Money lines are all at different odds, which complicates things. For this example, let's say the gambler is taking spread bets, with both sides having a roughly equal chance of winning. There are 1230 games in the season, we'll assume the favorite is a slightly better deal, so wins 51% of the time, and the gambler takes the favorite 96% of the time. Over 1230 games, the favorites go 627-603. The gambler takes 1181 favorites and 49 underdogs on the season.
The best they can possibly do on favorites is 627/1181 (53%), assuming they somehow manage to correctly bet on every single favorite that won that season. The gambler captured all of the favorites that won, so the rest of the games left over are underdog winners, meaning they'd go a perfect 49/49 in underdog games. Overall, the best they can do is (627+49)/1230, which is 54.9%. Since the break-even point is 52.4%, most of the profits are coming from the 49 underdog games.
By taking so many favorites, the pigeonhole principle means the gambler has to be perfect just to hit a 54.9% win rate. As I showed in Do you wanna win?, 54.9% is good enough to have a positive expected value on bets, but it's low enough that losing money over 1,230 bets is very possible, even with proper bankroll management. If hitting that number requires you to be perfect, it seems like a bad plan.
Here are the frequencies of odds taken by the public on the money line. There's an awkward gap in the middle. In the American way of writing odds, favorites are always -100 or smaller, and underdogs are always +100 or bigger.
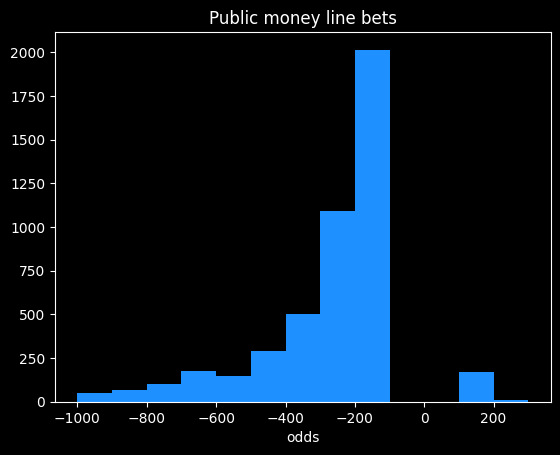
The public mostly takes bets in the -100 to -300 range, which is in the range where money line bets have been a slightly better value than spread bets over the past four seasons, so good for them. The biggest underdog bet the public took in nearly 5,000 bets was at +400 (implying the underdog had a 20% chance of winning.)
The public achieved -2.87% rate of return on money line bets. That's bad compared to the 0% rate of return offered by not betting, but it's better than the -4.5% on spread bets, and way better than the -20% on some types of parlay bets. Someone fading, or taking the opposite bets to the public, would achieve a -6.4% rate of return.
On the rare occasions the public does take the underdog, they make a profit. On those 183 bets, the public notched a +2.43% rate of return. Bets on underdogs will have a high amount of variance, so there could be some luck involved.
Point totals
In addition to who will win the game, gamblers can wager on how many total points will be scored. For instance, if the final score is 120-115, the point total would be 235. If the line was 230, the OVER side would have won, and the UNDER lost.
The point totals are pretty balanced. The over wins 50.6% (2672/5273) of the time. However, the public takes the over 88.3% (4660/4839) of the time.
The public did a little better than a coin flip, winning 51% of over bets, and 54.5% of the 178 under bets.
I was curious whether the percent of bets on one side was correlated with higher winning percentage. If 99% of the public took the over, is that a safer bet than if only 51% of the public took it? I've broken down the public's bets on the over by quartiles:
| start % | end % | num games | win % |
|---|---|---|---|
| 50 | 73.9 | 1165 | 50.5% |
| 73.9 | 82.4 | 1164 | 51.4% |
| 82.4 | 88.4 | 1163 | 50.9% |
| 88.4 | 100 | 1168 | 51.5% |
For 1,000 observations, a 95% confidence interval is roughly +/- $\frac{1}{\sqrt{1000}} \approx \frac{1}{\sqrt(33*30)} \approx 3\%$, which is much bigger than the difference between 50.5% and 51.5%. So the difference isn't significant.
Are sportsbooks leaving money on the table?
It's odd to me that the over would win more than 50% of the time when that's the side that usually has the most money on it. That's not a huge imbalance, but the sportsbooks would be making more money if they increased the point totals a bit so the over loses 51% of the time instead.
Gamblers betting on point totals are probably a little more savvy than ones betting the lines. It's kind of an odd thing to bet on. Doesn't matter who won, doesn't matter whether it was a good game or not. All bets are math problems, but point totals are more obviously a math problem than money lines or spreads.
Do point totals tell us anything about the evolution of the NBA?
It's possible sportsbooks haven't kept up with the evolution of the game. NBA point totals have gotten much higher over the past decade due to faster pace, better shooting and more 3 pointers.
Here is a graph of moving averages of the point totals for the past four seasons:
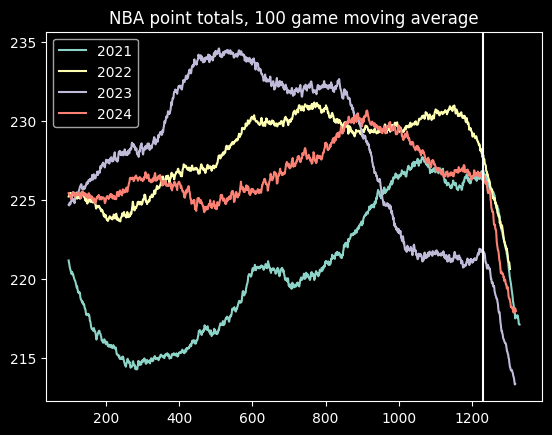
Point totals go down at the end of every year. That's because playoff games tend to be more tightly contested than regular season games. The vertical line is where the playoffs start.
There appears to be an increase in average point totals during the 2021 season, but it's stayed fairly consistent since then, with one notable exception. There's an big dip in point totals during the 2023 season, around game 800. This is almost certainly due to a directive from the NBA telling officials to call fewer fouls. Fans (and presumably gamblers) noticed right away, but the NBA only admitted the change well after the fact. Luckily, nothing has happened since then to further undermine trust in the NBA!