Last fair deal in the country
(This is an excerpt from a larger project about sports gambling. Code used, and early drafts of some of the chapters can be found at https://github.com/csdurfee/book.)

Efficiency of betting markets
The efficient market hypothesis says that given enough time and competition, free markets are able to establish the correct price for a commodity. In the case of sports betting, we could think of it as the price of a money line bet.
On a money line bet, you are betting on who will win the game straight up. You get a smaller payout for betting on the favorite, and a larger payout betting on the underdog. In the United States, money line bets are written in a goofy way. If the money line is negative, that's how much money you have to risk in order to win $100. For example, -200 indicates you have to risk $200 to win $100. If it is positive, that's how much money you win if you risk $100. If it sounds like a bad way to write the odds, you're correct.
A market maker will respond to an imbalance in bets by adjusting the price. If CLE -300 is a good value, people will rationally want to take it, driving the price up to, say -400. If it is a bad value, people will rationally want to take the other side and the price might go down to -200. These rational actors will collectively push the price towards the best possible estimate that humans can make given all information available at the time. It serves as a sort of collective intelligence.
In the first installment, I showed that humans are irrational when it comes to sports betting, so I was skeptical of how good, or fair, the lines could be. Could I find proof of this collective intelligence in action? Are there any obvious market inefficiencies?
The data & stuff to know
Stats are from the NBA season. I screen-scraped the data from sportsbookreview.com. All data is from the MGM Grand. Unfortunately, some data is missing around Christmas, and a few random days in between. 32 games are missing from the data set out of 1230 total, 2.6% of all games. These are games that don't appear on sportsbookreview's website, or have incomplete data on there.
This is an analysis of the MGM Grand's NBA lines for 2025. It's not a comprehensive guide to how the lines work.
There are always two lines on each game, one for the home team and one for the away team. Each side may have different vigs. Say for instance Bucks @ Pacers starts out at IND +3.5 -110/MIL -3.5 -110. It could close at IND +3.5 -115/MIL -3.5 -105. So it costs more to bet on the Pacers, but the actual line didn't move. I'm mostly ignoring that, but will point out when it's relevant.
"Line" and "spread" mean the same thing.
"Reduced juice" means risking -105 or -106 instead of the usual -110 to win 100. A "unit" is a gambler's standard betting size. "4.1 units of profit" would mean +$410 for a gambler betting $100 a game. Both are explained in much more detail in the book.
A note about pushes
When the final score agrees with the line exactly, neither side of the bet can be declared a winner. This is called a push. The bet is cancelled and everybody gets their money back. The casino makes nothing.
The MGM Grand always keeps point spreads on the half point (eg +6.5 or +7.5 rather than +7) so that they will never push. I don't think it's a bad policy, and I'm surprised more sportsbooks don't do it. The sportsbooks know how good their customers are at betting, so they should probably shade the point spread a half a point towards the side of the bet that has the less savvy bettors on it. (This assumes the sportsbook can identify and ban arbitrage gamblers, but more about that in the book.)
Analysis
If there is a wisdom of crowds, the final lines should be more accurate than the opening lines. Are they?
My code calculates the difference between the final score and the line, called the error. Because the MGM's lines always end in a half point, that means the error is going to be artificially high -- there will never be a game where it is exactly zero.
The opening and closing lines are a set of predictions. The smaller the difference between the line and reality, the better the prediction. Mean Squared Error is a standard way to compare two prediction systems in statistics and machine learning.
The MSE for the opening lines is 191.06, and the closing lines is 184.8. So we can say that in aggregate, the closing lines are more accurate than the opening lines.
MSE can't tell us how good the closing lines are, though, just that one set of predictions is better than another set. It's a relative measure, not an absolute one. We're squaring the error, so the MSE will always be positive. The errors in one direction don't cancel out ones in the other direction.
Let's look at how far the lines were off by. the Os are the opening lines, and X's are the closing lines. If the X is closer to the center line than the O, the market action made the line more accurate. I've plotted a random sample of 300 games to make the plot more readable.
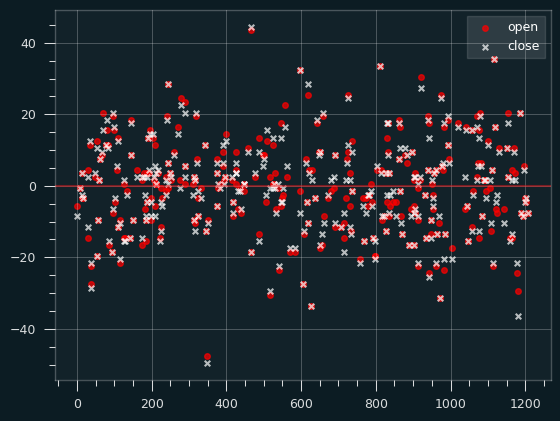
Unfortunately, that doesn't really show us much about how or when the closing lines are better than the opening ones.
Adam Smith, Handicapper
When were the closing lines more accurate than the opening lines?
The closing lines were better in 467 games, versus 384 games where the opening lines were better, and 347 games where the line never changed.
If the free market were a handicapper, and we interpreted the line movements as a bet on one side, they would have a 54.88% winning percentage (and 347 pushes).
While that's a respectable win percentage for a human trying to beat the spread, I was expecting better from the free market. The market only being right 55% of the time holds true for a couple of previous seasons I have looked at as well. NBA betting, as a market, is not very efficient.
There are good reasons for that. Sportsbooks that set the opening lines aren't trying that hard to be accurate. It's just a first guess. Only a tiny percentage of money is wagered at the opening line number. However, there are good reasons why lines tend not to move very much, even when the opening line is a bad one. For an in-depth explanation, check out The Logic of Sports Betting, by Miller and Davidow.
The myth of closing line value
The conventional wisdom is that sports betting markets are efficient, so that the only way to make money over the long run is by doing better than the closing lines, picking up on any flaws in the opening lines before the market eliminates them. Anyone else can only make a profit due to chance. From this perspective, the right way to measure a handicapper's skill is how their picks compare to the closing line. Say the opening line is Nuggets -3, and I take the bet at that number. The closing line is Nuggets -6. Then I captured 3 points of value against the closing line. This is known as closing line value (CLV). (We can figure out how valuable those 3 points are, and I show how in the book.)
Beating the closing line might be positively correlated with higher profits when analyzing betting records of touts -- people who sell betting picks for money. But when the market is wrong 45% of the time, focusing too much on CLV seems like a bad idea. There's no good reason to believe that a gambler is destined to lose money by picking against the closing lines. What if their strategy is to mostly bet against the prevailing wisdom on the 45% of games where the market is wrong?
CLV is a prime example of Goodhart's Law. As a measure of a handicapper's skill, it's probably fine (though not ideal). But it shouldn't be the target. A gambler shouldn't make picks explicitly to capture as much CLV as possible. That could be different on other sports. Football -- both forms of it -- attracts a lot more betting than the NBA does, so if you're looking for the wisdom of crowds, maybe look there.
Say the opening line is Nuggets -3 against the Timberwolves. I like the Nuggets in this matchup, but I think the public will go for the Timberwolves and it will finish at Nuggets -1/Timberwolves +1.
If I was trying to capture as much CLV as possible on this bet, I should take the Timberwolves +3 on the opening line, even though that's not the side I actually like!
If I was trying to actually win the bet, I should take the Nuggets at the closing line, hoping maybe I can get Nuggets -1 or even Nuggets +1. I can never get positive CLV on the Nuggets, because the market was wrong about them. Not me, the market!
CLV gets described as being the best way to test a handicapper's skill, but it's obviously non-optimal. Maybe it's the contrarian in me, but Opening Line Value -- identifying bets where the market is going to be wrong, and waiting till the last minute to place the bet -- is more impressive.
The best way to test a handicapper is to have them write out what they think the lines should be, rather than making a binary decision about somebody else's line (favorite or underdog). If a handicapper's lines are closer to the truth than the closing lines, they are good at handicapping. Looking at what bets they took is only a secondary signal of that. If they took Nuggets -7, is it because they thought the true line should be Nuggets -8, or Nuggets -12?
When the line doesn't move
Setting aside why the market moves in the wrong direction 45% of the time, I'm curious about the games where the spread didn't move at all. Maybe those lines were perfect as-is? If so, we'd expect to see equal splits of home vs. away winners, and underdog vs. favorite winners. There shouldn't be any bias to those games. The free market is essentially labelling these the pinnacle of the handicapper's art, impossible to be improved upon.
The difference between the predicted outcome (the line) and the actual outcome is a combination of how much the line maker got it wrong, plus random variation. So the games where the line didn't move should be totally random, right?
They're not. If we look at games where the line didn't move, the away team went 184-163 in those games. Someone betting the away team in every game where the line didn't move would win 53% of their bets, for 4.7 units of profit at full vig, or 11.2 units of profit at reduced juice.
There's also a bias towards underdogs, who went 186-161 in this situation. Always taking the underdog would give a 53.6% winning percentage, for 8.9 units at full vig, or 15.3 units at reduced juice.
There's an even bigger bias if we combine the two. Away underdogs went 122-92 in these games, which is a 55.2% winning percentage, for 13.1 units of profit at full vig, and 17.1 at reduced juice.
None of these results are statistically significant, but they are very :thinking_face_emoji:
About the vig
When the vig is imbalanced, the side with the higher vig should be more likely to win, because they're winning less money in return. Moving the vig from -110 to -115 is a way for the bookmaker to discourage bets on one side without moving the line. Likewise moving it to -105 is a way to encourage bets on that side.
Since the MGM Grand always keeps their lines on the half point, we'd expect them to adjust the vig often rather than change the spread. They do for most of the games where they didn't move the lines, but 39% of the time the vig stays at -110.
If we break down the games where the line didn't move by vig, the underdogs went 62-43 when the vig was high (-115), 74-62 when the vig was at the standard level (-110), and 50-56 at low vig (-105).
Someone taking the underdogs when the line doesn't move, and the vig is -110 or -115, would've gone 136-105 this season, a 56.4% winning percentage, and around 18 units of profit (factoring in the additional -115 vig on some bets).
Now, the strategy is pretty convoluted, and I wouldn't bet on it holding for future seasons, but it's definitely evidence there could be irrational factors at work in the market. It certainly doesn't show the market to be the well oiled machine that Closing Line Value assumes it is.
Must love dogs
Winners ended up being pretty evenly divided between favorites and underdogs by the end of the season, but underdogs were way ahead for most of the year.
Betting every single underdog against the spread over the first quarter of the season would've been fairly profitable -- a 165-136 record (54.8% winning percentage), and 15.4 units profit at full vig. People betting favorites got killed at the beginning of the season.
Dogs and favorites were basically even through the middle half of the season, before favorites finished off 167-144 (53.7% win percentage) to even things out.
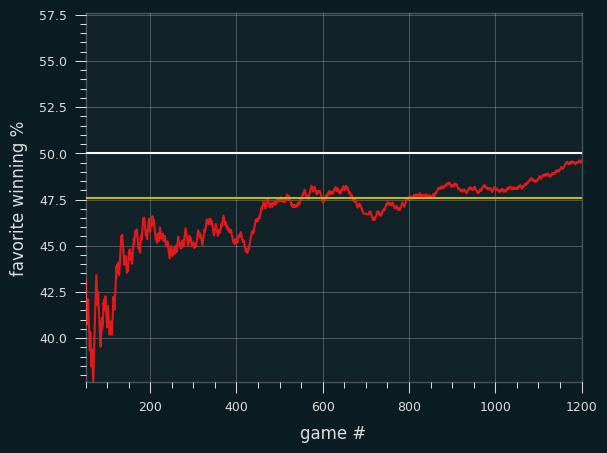
Here's a plot of the winning percentage of favorites over the course of the season. I skipped the first 50 games because of noise. The yellow line represents the winning percentage necessary for betting all underdogs to be profitable (at standard vig). That happens when the favorites win less than 47.6% of the time (which means underdogs win more than 52.4% of the time.)
It wasn't until the last month of the season that blindly betting all underdogs started being a losing proposition, even factoring in the vig.
Did the lines improve over time?
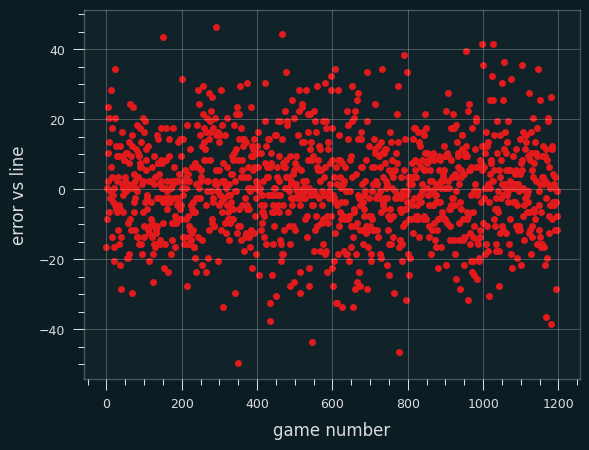
I was curious if there was evidence that the errors were getting smaller, or more predictable over time.
The raw errors are too noisy to see any sort of pattern:
This is a plot of the 100 game moving average of the absolute error of the closing line. I don't see any trends to suggest the lines got more accurate with time.
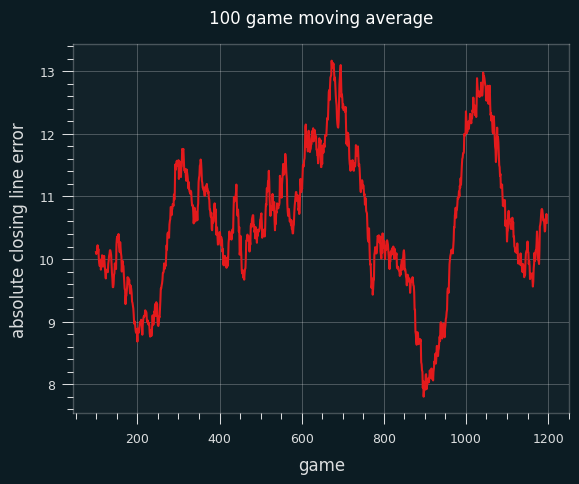
The size of the error against the closing line isn't the ideal metric, because not all points are created equal -- the higher the line, the less surprising the error. (I'm going to skip discussing that for now, but it's explained in the book.)
Did the lines change over time?
I wondered whether the size of the lines changed over time -- did the games get more or less competitive over the course of the season?
This is a 100 game moving average of the average size of the spread. As we can see, the lines did get bigger near the end of the year.
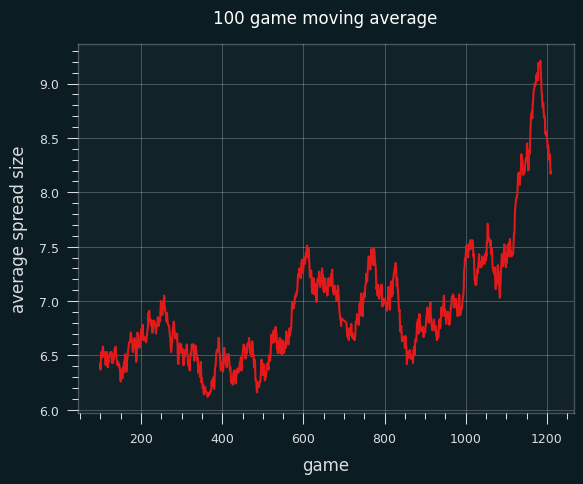
It's possible the trend is due to scheduling, but the change at the end seems significant -- teams tend to give up near the end of the year. Bad teams want to be as bad as possible in order to get the best odds in the NBA draft, so they're not that competitive.
(I have a lot more to say about tanking, but I'll stay off my soapbox for now.)
What type of games are affected by line movement?
There were 130 games where the winner flipped from the favorite to the underdog, or the underdog to the favorite, because of the line movement. In other words, these are games where either side could have won the bet, depending on whether you took the opening line or the closing line.
These games were perfectly balanced -- 65 times, the favorite won (vs the closing line); 65 times the underdog won.
What about games where the spread was extremely accurate (off by 3 points or less)? Underdogs went 138-121 in those games (53.2%).
The difference is more dramatic in games where the line was off by 1 point or less. The underdogs went 56-33 (63% win percentage). Of course, there's no way to use that as a betting strategy since we can't identify these games before the fact, but it does show a small potential bias in favor of underdogs.
What would "perfect" lines even look like?
It's rare to see NBA lines that are bigger than +15/-15 points. There were 15 this season, about 4.4% of all games. That's around one NBA game a week with a line that high.
By contrast, 31% of NBA games end with a score differential of over 15 points. That's 7x more often, roughly one game a day.
The lines really shouldn't be as large as the final score differential, because they are an estimate of the mean outcome of the game. If the Celtics beat the Raptors by 54 points, that doesn't mean the line should have been Celtics -54. The Celtics and Raptors played 4 times last season (data taken from basketball-reference). I'm going to ignore home court advantage -- imagine these are played at a neutral gym. The first game, Boston won by 3. The second, Boston won by 54. The third game, the Raptors won by 13. The last game, Boston won by 10.
Boston won by an average of 13.5 points, so BOS -13.5 would be a reasonable line for all four games, as that's the best estimate we can make of their difference in skill. Only 1 of the 4 games ended up close to that line. For the other 3 games, the error was at least 10 points. That's pretty typical for NBA games. The error is usually around 10 points.
In this scenario, Boston -- despite being the much better team -- would have gone 1-3 against the spread. If the line for all four games was BOS -9.5, they would have gone 2-2, but the error would still be 44.5 points on the second game, and 23.5 on the third one.
The actual outcomes might be all over the place, but the spread isn't meant to predict the actual outcome, just the point where both sides are equally likely to win the bet. In a small sample size, there's no guarantee both sides will win 50% of the games, even if the line was perfect.
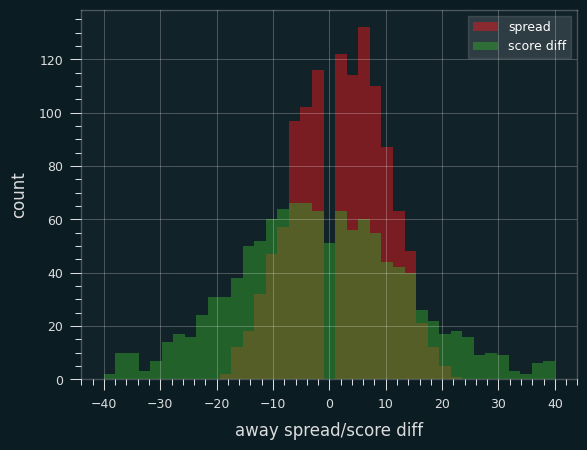
Here's a histogram of the spreads (for the away team) overlaid on a histogram of the errors against the spread:
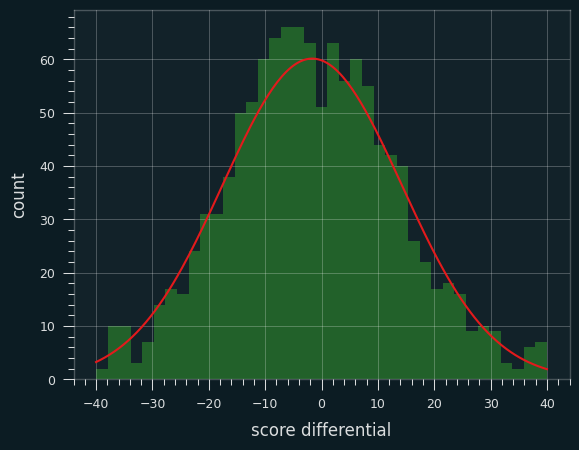
If we look at just the score differential, we can stick a bell curve over the top and it looks pretty normal:
Simulating games from the spreads
The problem is, these aren't outcomes from one distribution. Every game is essentially a sample from a different distribution. Each game has a different mean (the spread, or rather the ideal version of it) and a different variance (how predictable games are between the two teams). Combining them all together, the results end up looking kinda normal (because a lot of things do).
I decided to simulate the entire season to show how the point differentials are going to be much bigger than the original lines.
I simulated every game by sampling from a normal distribution with the mean set to that game's spread, and the variance equal to the sample variance of all games that season with that spread.
Here's how they match up:
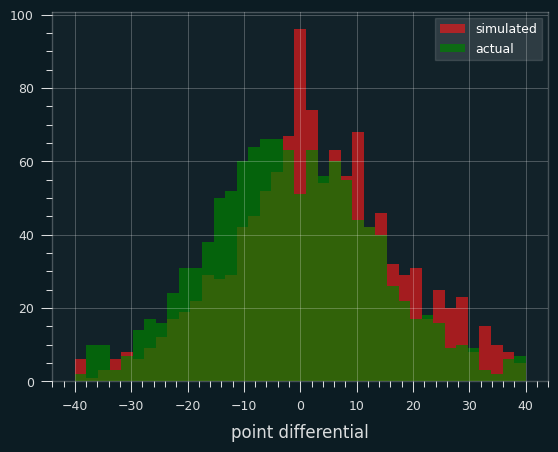
I know that's a pretty rough simulation. There's some weirdness in the middle. NBA games never end in a tie, and they end in a one point difference less often than expected due to tactical reasons, so there's a little notch right in the center of the green curve. If a team is down one, they foul the other team and hope they miss at least one of their free throws. There's also more simulated games than I would expect that end with a differential of +1 or -1. There very well may be a bug in my code. So there's a muddle in the middle. But the spread of the data is the same, which is the main point.
Hopefully the simulation shows that the lines shouldn't be bigger than they are, even though they are frequently off by many multiples compared to the final result. An error of 10 is about what we'd expect on average, and big errors don't necessarily mean Vegas was wrong. If the line is Dallas -3 and the other team wins by 27, that doesn't mean the line was off by 30 points. The line is meant to be an estimate of the mean outcome, if the teams played each other a large number of time under the exact same conditions. We only ever see one sample, though, and a lot of times it is far from the mean.