Jan 10, 2026
Song: Sam and Dave, "Hold On, I'm Coming"
Code: https://github.com/csdurfee/scrape_yahoo_odds/blob/main/explore_football.ipynb
This week, more insights into NFL betting from BetMGM gambling data (harvested from Yahoo). I'm looking at the last 5 seasons of regular season NFL games (2021-2022 thru 2025-2026). There are 1,359 games total, around 140 of which are missing betting percentage data, so have been excluded from parts of this analysis.
Point totals
Gamblers can wager on whether the total number of points scored in an NFL game will be over or under a certain number. These bets are sometimes called over/unders.
Spreads are a wager on the difference in team scores, and point totals are a wager on the sum. It's kind of an odd bet, because it doesn't matter which team wins. All bets are math problems, but over/unders are more obviously so.
The over has won 48.4% of the time (658/1359 games). Point totals almost never push (hit the number exactly, meaning neither side wins). That's only happened in 12 of 1358 games. About 60% of point totals are on the half point (6.5 instead of 6, for example), so they can't push.
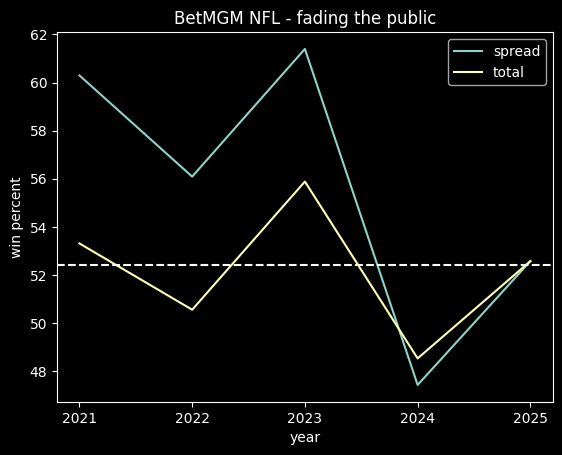
The win rate for overs has changed over the past 5 seasons. The over won about 46% of the time from 2021-23, and 53% of the time from 2024-25. That possibly mirrors what we saw last time -- it was wildly profitable to fade the public on spread bets from 2021-23, and wasn't the last two seasons. I don't have a good theory as to why the win percents mirror each other.
Taking the under is usually equivalent to fading the public, because as with the NBA, the betting public greatly prefers the over on point totals, taking them 86.8% (1056/1217) of the time. When the public takes the over, they win 48.1% of the time. On the rare occasions where they take the under, they win 46.6% of the time. So, this is yet another example of where gamblers as a whole do worse than a coin flip. In 3 of the 5 seasons, they did poorly enough that fading their picks would have been profitable.
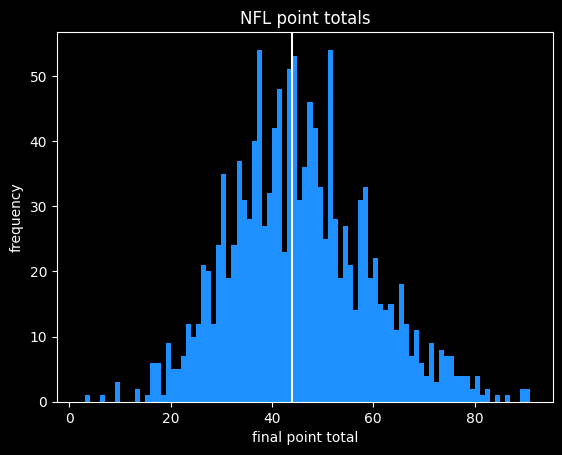
Half of all point total spreads are between 41.5 and 47.5, with the median being 44.5. A naive betting strategy would be to assume that low point totals are too low (always take the over if the total is less than 44.5), and high point totals are too high (take the under if the total is greater than or equal to 44.5). This strategy would've gone 700-658 (51.6%). It's not much, but there might be a slight advantage to betting on boring point total outcomes.
Here are the win rates for betting on the over, by point total range (split by quartiles):
| start (>) |
end (<=) |
over won |
over lost |
over win percent |
| 0 |
41.5 |
211 |
185 |
53.2% |
| 41.5 |
44.5 |
161 |
200 |
44.5% |
| 44.5 |
47.5 |
151 |
140 |
51.9% |
| 47.5 |
max |
134 |
176 |
42.2% |
Some of the variation is just noise, but based on this breakdown, taking overs on high point totals seems like a bad move.
Here are what the actual point totals look like:
Point total errors
Here are what the errors against the point total look like. Positive values are games that went over the total, negative are games that went under.
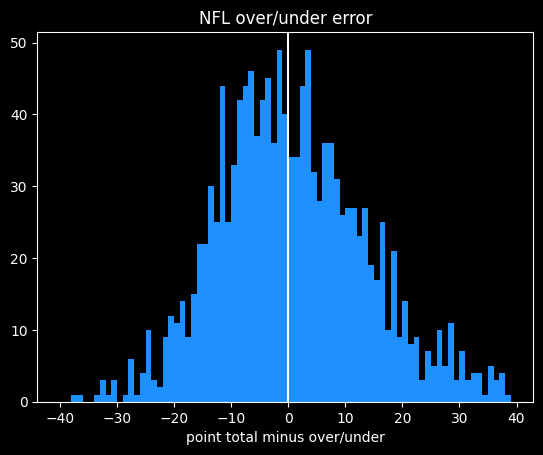
The median error is -0.5, so the errors are fairly balanced even if the graph isn't symmetrical. As with other NFL data, there are spikes because some point totals are more likely than others.
There's a longer tail to the positive side than the negative -- it's impossible to score fewer than 0 points, which limits how far under a bet can go, but there's theoretically no limit to how many points the teams can score in the over direction.
Here's how the total errors break down.
count    1358.000000
mean        0.767305
std        13.402751
min       -37.500000
25%        -8.500000
50%        -0.500000
75%         9.000000
max        57.500000
Point totals are off by an average of 10.6 points. Here are the details about the absolute value of the error:
count    1358.000000
mean       10.561119
std         8.282722
min         0.000000
25%         4.000000
50%         8.500000
75%        14.500000
max        57.500000
NFL money lines and the favorite-longshot bias
A money line bet is the simplest type of bet to understand, because it's a wager on who will win the game outright. A bet on the underdog will pay out more than you have to risk, because it's less likely to happen.
Money line data is always going to be high variance -- one +400 bet winning or not can wildly change the Expected Value. That was a problem with the NBA, which has 5x the games of the NFL, so it's definitely going to be a problem here.
The public's money line picks do better than their spread picks. They're making an average of -3.1% on money line bets, which is a step up from the -6.7% they're doing on the spread. That mirrors the NBA, where the public does significantly better on the money line than spread bets.
The public is also a slightly better Expected Value than taking money line bets randomly. The public are saved by their love of favorites, which they took in 96% (1181/1228) of games, and are a relatively good deal on the money line.
Each bet has two sides. Underdog money lines on NFL football are a bad bet in general (-7.3% EV), but huge underdogs are especially bad (-29.7% EV). This is evidence of the favorite-longshot bias in NFL betting. A -30% EV puts longshot underdog money lines in the same league as the biggest sucker bets you can take -- Same Game Parlays, 4+ leg parlays, and teasers.
"EV %" is the expected value of taking every bet in each category. Overall, money line bets have a -5.5% EV.
| label |
start |
end |
num games |
EV % |
| all favorites |
-9999 |
-1 |
1271 |
-3.9% |
| mild favorites |
-200 |
-1 |
662 |
-2.8% |
| heavy favorites |
-400 |
-200 |
406 |
-7.5% |
| huge favorites |
-9999 |
-400 |
203 |
-0.2% |
| ---------------- |
---- |
---- |
---- |
------ |
| all dogs |
1 |
9999 |
1185 |
-7.3% |
| mild dogs |
1 |
200 |
663 |
-5.4% |
| heavy dogs |
200 |
400 |
399 |
-3.4% |
| huge dogs |
400 |
9999 |
123 |
-29.7% |
| ---------------- |
---- |
---- |
---- |
------ |
| everythang |
-9999 |
9999 |
2456 |
-5.5% |
That -29.67% for huge dogs is hiding a big discrepancy. Huge home dogs (>= +400) have actually made money, winning 8/31 games. Huge away dogs have only won 6/92 games, for an absurd -63% Expected Value. The average odds for these bets is +600 (1 in 7 chance of winning), so we'd expect 13 of 92 bets to win, not 6.
Like I said at the top, money line dogs are going to be extremely variable, and the +400 number is a totally arbitrary cutoff. But even if huge away dogs had won twice as often, they'd still be unprofitable. Woof!
Money line favorites turn out to be a slightly better value than spread bets. But the estimated EVs are very sensitive to changes. I've been working on this project for a couple of weeks now, and noticed the numbers changing pretty significantly over the last 2 weeks of the NFL season. So the estimates are not telling the whole story about the range of possible outcomes.
Bootstrapping money lines
Since every bet has a different payout, they're not going to follow some nice, polite distribution. In order to estimate the variance in outcomes, I'm going to use bootstrapping, a popular technique in these parts.
I'm using the scikits-bootstrap library to generate a 90% confidence interval for the Expected Values. It samples random subsets of the bets in each category and calculates the EV of each subset. Then it returns the 5th and 95th percentile outcomes, which is a plausible range of values for the EV.
| label |
start |
end |
num games |
5th %ile |
EV |
95th %ile |
| all favorites |
-9999 |
-1 |
1271 |
-7.2% |
-3.9% |
-0.6% |
| mild favorites |
-200 |
-1 |
662 |
-8.3% |
-2.8% |
2.4% |
| heavy favorites |
-400 |
-200 |
406 |
-13.0% |
-7.5% |
-2.6% |
| huge favorites |
-9999 |
-400 |
203 |
-5.3% |
-0.2% |
4.0% |
| ---------------- |
---- |
---- |
---- |
------ |
--- |
----- |
| all dogs |
1 |
9999 |
1185 |
-14.0% |
-7.3% |
-0.2% |
| mild dogs |
1 |
200 |
663 |
-12.6% |
-5.4% |
2.3% |
| heavy dogs |
200 |
400 |
399 |
-16.5% |
-3.4% |
10.5% |
| huge dogs |
400 |
9999 |
123 |
-55.3% |
-29.7% |
4.7% |
| ---------------- |
---- |
---- |
---- |
------ |
--- |
----- |
| everythang |
-9999 |
9999 |
2456 |
-9.1% |
-5.5% |
-1.7% |
Those are some pretty wide confidence intervals. Even the big categories like all favorites lead to a wide range of outcomes.
Even with the -29.7% EV for huge dogs, we can't rule out some small hope that somebody could make money taking them, I suppose. But as always, if there's randomness involved, we don't get to pick whether we get the 5th percentile result, the average result, or the 95th percentile result.
Mathletix Bajillion, playoffs round 2
After a dramatic 10-0 run by the Hand-Eggs, both teams are now in the black for the season.
Lines taken Wednesday morning
The Neil McAul-Stars
last week: 3-2, +88
Overall: 25-24-1, +3
line shopping: +143
- BUF +1 -101 (prophetx)
- SF +7 +104 (prophetx)
- NE -3 -109 (prophetx)
- CHI +4 -104 (prophetx)
The Vincent Hand-Eggs
last week: 5-0, +501
Overall: 25-22-3, +214
line shopping: +134
- NE -3 -109 (prophetx)
- SEA -7 -108 (prophetx)
- BUF +1.5 -107 (prophetx)
- LAR -3.5 -110 (prophetx)
Jan 07, 2026

Song: Stereolab, "Wow and Flutter"
This time, I'm looking at NFL gambling statistics from the last five seasons. The data is from BetMGM, scraped from Yahoo's website (example page) via an internal API (example request).
My previous analysis of NBA betting data from the same source is available here. Code is available at https://github.com/csdurfee/scrape_yahoo_odds/.
There's not as much NFL data as I'd like, or any data nerd would. We only have 1,360 games worth of data spread over the five years since gambling was legalized. Around 140 of those games are missing data about betting percentages, so have been excluded from most of the analysis. I'm only looking at regular season games.
As usual, I'm presenting this data because I think it's an interesting window into how people and markets behave around sports. There's no reason to believe the trends I highlight here will continue in the future. It's not eternal, imperishable. Which is to say: I don't think you should bet on the information given here, or at all.
Previously, in the NBA
When I looked at the NBA, I found that a bet on the public side, the side that gets more money bet on it, wins 49.2% of the time against the spread. So there's a slight bias against the public, but not enough that somebody could make money betting the opposite way.
I was expecting something similar for the NFL. I believed that NFL lines were probably quite fair, meaning no matter how you slice the data -- home vs. away team, favorite vs. underdog, popular vs. unpopular side -- a gambler will end up losing over the long run no matter which side they take.
Turns out, that's not true.
Spreads: the popular side gets crushed
The side with a higher wager percentage (by number of bets placed) has gone 605-755 over the past 5 years. That's a winning percentage of 44.5%. Someone taking the unpopular side (fading the public) on every NFL game would've won 55.5% of their bets, for a profit of 89.5 units at standard -110 odds. That's an Expected Value of +6.6% on each bet.
Here are the winning percentages for fading the public by year:
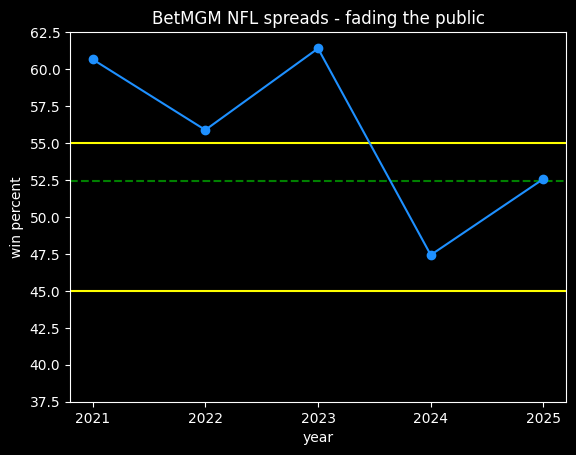
The yellow lines are a 90% confidence interval, assuming that fading the public should only win 50% of the time. 2021-2023 are outside the range we'd expect due to chance, but 2024 and 2025 have been in range, so whatever trend may have been causing the imbalance could already be gone. For instance, gamblers may have gotten more savvy over time, or the lines less imbalanced because of more market competition.
The green dotted line is at 52.4%, the minimum win rate to break even at -110 odds. The average entrant in the Super Contest has never exceeded that in 13 seasons, while fading the public has done so in 4 out of 5 seasons.
There are a fair number of games where the stake percentage (amount of money) and the wager percentage (number of bets) disagree about which side is the public side. Excluding those games leads to even more impressive results -- a 649-500 record against the spread for the unpopular side. That bumps the win percentage up to 56.5%, and +99 units at -110 odds, or +124 units at reduced juice. That's an expected value of +8.6% on each bet.
We should expect pretty much any binary slice of the data to win between 47 and 53% of the time, assuming the imbalance is due to chance. For example, the home team went 650-710 (47.8%) against the spread. The underdog went 681-679 (50.1%). Home underdogs went 260-275 (48.6%).
Of course, this is hindsight bias. Imagine if, 5 years ago, someone had proposed to always fade the public on the NFL. I would have thought it was a bad idea. Wouldn't you?
Other spread trends
The public tends to favor the away team, taking it in 724/1340 games (59% of the time).
They also generally take the favorite on the spread. They took the favorite in 877/1340 games (64.5% of the time).
Both of those trends were true for NBA basketball as well. Gamblers seem to love their away favorites. When there's an away favorite, they take it 78% of the time (415/535 games). When there's an away underdog, they take it 54% of the time (448/824 games).
Chunky spreads
Some final scores in football are more likely than others. Scorigami, yadda yadda.
That means point differentials are going to have differing degrees of likelihood. A final score difference of 3 is going to be more likely than 5, because scoring a field goal to win a tie game is more likely than the long sequence of actions that would lead to a 5 point differential. (For example, one team might be up by 8 and the other team scores a field goal.)
The spreads are an estimate of the mean outcome of every game, not a guess at the final outcome. So they'll be less widely dispersed, but they should have roughly the same shape. For more detail, see the section "What would perfect lines even look like?" here.
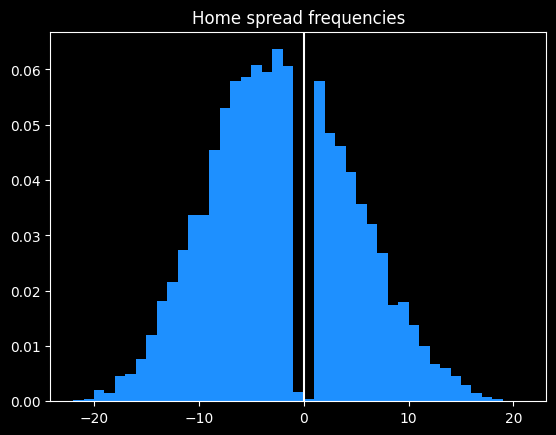
Here are NBA point spreads. Except for a bit of weirdness in the center due to NBA not having ties, and winning/losing by one point being rare for basketball reasons, it's a nice smooth curve:
Here's what spreads for the NFL look like. The lack of data isn't helping, but the overall shape clearly isn't a nice smooth curve. The spikes are much higher for certain numbers.
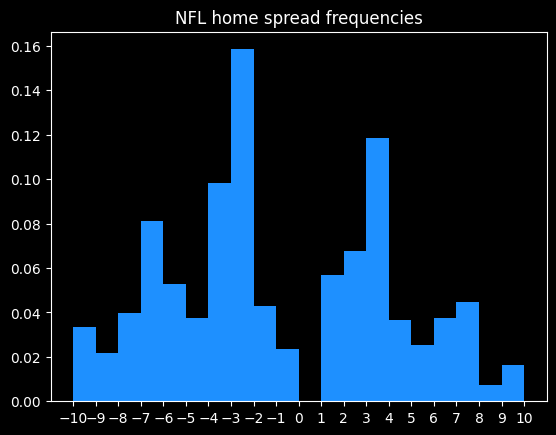
Here are the most common home spreads. These represent 73% of all NFL spreads.
|   spread |   count |   cumulative % |
|---------:|--------:|---------------:|
|     -3   |     109 |              8 |
|      3   |      90 |             15 |
|     -3.5 |      89 |             21 |
|     -2.5 |      86 |             28 |
|      2.5 |      64 |             32 |
|      3.5 |      56 |             36 |
|     -6.5 |      51 |             40 |
|     -7   |      49 |             44 |
|     -1.5 |      40 |             47 |
|      1.5 |      38 |             49 |
|     -7.5 |      37 |             52 |
|     -5.5 |      37 |             55 |
|     -4.5 |      37 |             58 |
|      7   |      35 |             60 |
|     -4   |      32 |             63 |
|      1   |      32 |             65 |
|     -1   |      28 |             67 |
|     -6   |      28 |             69 |
|      6.5 |      27 |             71 |
|      5.5 |      27 |             73 |
NFL betting is a game of 3's. 36% of lines are around +3 or -3. It's unusual to see lines that are greater than 7 or less than -7.5.
Actual point differentials
What about the differentials of actual games? I had to pull scores from another datasource, since the yahoo API only provides gambling data. I'm using the score data from pro-football-reference.com.
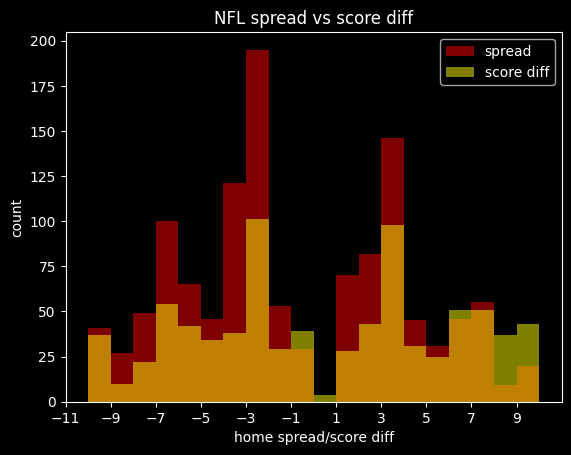
Here are spreads and final score differentials laid on top of each other. The orange part is where they overlap. The score differentials are much more dispersed, but they both show similar spikes at certain numbers:
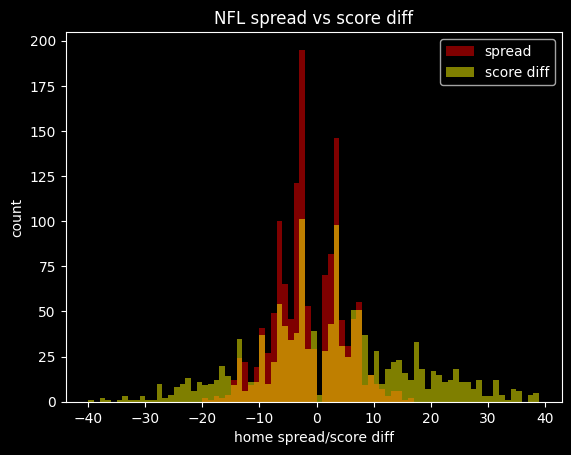
The spikes at the 3's and 7's are a bit more legible if I zoom in:
Here are the most common final score differentials for the away team -- which would be the seemingly ideal point spreads for the home team.
|   away_score_diff |   count |
|------------------:|--------:|
|                 3 |     101 |
|                -3 |      98 |
|                 7 |      54 |
|                -6 |      51 |
|                -7 |      51 |
|                -2 |      43 |
|                 6 |      42 |
|                 1 |      39 |
|                 4 |      38 |
|                10 |      37 |
|                -8 |      37 |
|                14 |      35 |
|                 5 |      34 |
|               -17 |      33 |
|                -4 |      31 |
Lots of the games end on 3's, 7's and 6's, just like the lines. Unlike the lines, none of them land on the half point.
The average outcome in the NFL is the home team winning by 2 points, so that's a decent estimate of home field advantage.
About half of all NFL games are within 8 points (a touchdown and a 2 point conversion) of the average outcome.
count    1359.000000
mean        2.062546
std        14.187563
min       -40.000000
25%        -6.000000
50%         2.000000
75%        10.000000
max        50.000000
Name: home_score_diff, dtype: float64
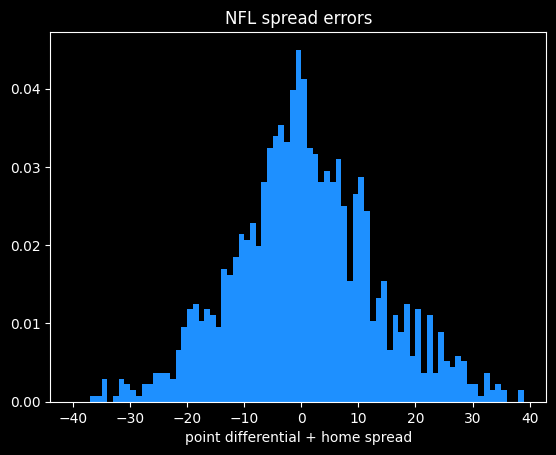
What do errors against the spread look like?
Let's compare the final point differential to the spread. The spread should be an unbiased estimate of the mean outcome between the two teams. We only get one data point to judge the quality of the line's estimate of the mean, which is sort of unfair, but that's just how it works with sports betting. I'll refer to the difference between the point differential and the spread as the error.
As I talked about in "Last fair deal in the country", because the line makers aren't trying to predict the actual outcome, merely the average outcome, some large errors are inevitable. The line makers can't actually predict the future, and aren't really trying to.
For example, the Miami Dolphins once beat the Broncos 70 to 20. The spread on the game was Dolphins -6, meaning it was off by 44 points relative to the final score. That doesn't mean the line really should have been Dolphins -50, though. It's hard to believe that if the game were played over and over again, the Dolphins would win by an average of 50 points, which is what a 50 point line signifies.
So we need to look at the errors as a whole rather than individual games to decide whether the line makers are good at their jobs or not. If the spreads are fair, the average error should be zero, and the errors should be fairly symmetrically distributed -- there should be about as many games where the error is -7 as it is +7, for instance.
Here's what the errors look like. The median is exactly zero, so kudos to the sportsbooks for that one. The right side is where the home team outperformed the spread, and the left is where they underperformed. There are a few more blowouts against the spread (more than 20 points) for the home team than the away team, but otherwise it's reasonably symmetrical.
count    1358.000000
mean        0.437040
std        12.628641
min       -37.000000
25%        -7.375000
50%         0.000000
75%         8.500000
max        44.000000
Name: spread_error, dtype: float64
Next week: much more on NFL betting.
Mathletix Bajillion, playoffs round one edition
Both teams had wicked regressions to the mean this week.
I'll finish the season out, but I'm tempted to quit, because I think I've proved my point about line shopping: both teams are essentially earning a free bet every 30 or so bets by using betting exchanges rather than retail sportsbooks.
Both teams ended up making similar picks, because there are only 6 games to choose from.
Lines taken Wednesday morning
The Neil McAul-Stars
last week: 1-4, -330
Overall: 22-22-1, -85
line shopping: +135
- CAR +10.5 +100 (lowvig)
- CHI +1.5 -109 (prophetx)
- JAX +1 -107 (lowvig)
- PIT +3 -105 (lowvig)
- SF +5 -107 (prophetx)
The Vincent Hand-Eggs
last week: 5-0, +500
Overall: 20-22-3, -287
line shopping: +133
- CAR +10.5 +100 (lowvig)
- NE -3.5 -109 (prophetx)
- BUF -1 +101 (prophetx)
- SF +5 -107 (prophetx)
- CHI +1.5 -109 (prophetx)
Nov 14, 2025

Song: Scientist, "Plague of Zombies"
This is a departure from the usual content on here, in that there's no real math or analysis. There's also not much of an audience for this website yet, so I hope you'll indulge me this week.
I was curious what all these gambling shows talk about for hours, when the picks they produce collectively appear to be no better than randomly chosen. I'm always interested in how people make decisions. How does their process work for choosing what bets to take? How might it work better?
Before I get too far into this, I know I'm being a killjoy. These podcasts are for entertainment purposes, just like betting is entertainment for a lot of people, not a sincere attempt to make money over the long term. Some degenerate gambling behavior is part of the appeal of these podcasts. They're selling the idea that "gambling is fun" as much as any particular bets.
It's still weird to be a gambling expert who can't do better than a coin flip.
I previously showed how combining multiple machine learning algorithms thru voting will only improve results when they make independent mistakes, and are significantly better than guessing. Those are both pretty intuitive conditions, and I think they're true of groups of people as well. If everybody has the same opinion, or makes the same sort of mistakes, or nobody really knows anything, there can't be a wisdom of crowds.
Humans have a big advantage over combining machine learning algorithms. We can talk with each other, challenge each others' assumptions, provide counterexamples, and so on.
There's not a ton of that in the gambling podcasts I listened to. Gambling talk is all about inventing stories about the future. It's sort of a competition for who can pitch the best narrative for the game. These stories are almost their own literary genre, and the construction of these are more important than the picks themselves. There aren't a lot of opportunities for the wisdom of crowds or some sort of error correction to occur.
Imagine I had a magic black box that was right about NBA lines 56% of the time. I could sell those picks, and be one of the better handicappers on the internet. While I could certainly write a little story for each one, maybe in the style of Raymond Carver -- "Will You Please Take The Over, Please?" -- the story doesn't make the bet more likely to be true, though, right? A factual story would be the same for every bet, and not very interesting: "there is slightly more value on this side of the bet, according to the model."
What we talk about when we talk about sports betting
Gambling personalities are always talking about what has happened in the past -- connections to previous games they've bet on, dubious historical trends, and the tendencies of certain players. Interactions like, "I thought you had a rule never to bet against Baker Mayfield?" "But he's 2-7 on the road in early Sunday games after a Monday night game where he got over 30 rushing yards."
These arbitrary connections remind me of a bit from Calvino's Invisible Cities:
In Ersilia, to establish the relationships that sustain the city's life, the inhabitants stretch strings from the corners of the houses, white or black or gray or black-and-white according to whether they mark a relationship of blood, of trade, authority, agency. When the strings become so numerous that you can no longer pass among them, the inhabitants leave: the houses are dismantled; only the strings and their supports remain.
There were quite a few of those useless strings in the November 6th episode of the Ringer Gambling Show.
The top bun
On a couple of occasions, the show discussed whether certain information was already priced into the line or not. Since gambling should be about determining which bets have positive expected value, that's a very useful thing to discuss. "If this spread looks wrong, what does the market know that we don't? Or what do we know that the market doesn't?"
If the goal is to win, the implicit question should always be: why do we think we have an advantage over other gamblers taking the other side? Why are we special? Why do we think the line isn't perfect?
Superstitions and biases
They were resistant to bet on teams that they had recently lost money on -- not wanting to get burned again. This is clearly not a financial choice, but an emotional one. The axe forgets, the tree remembers.
Team loyalty also affected their betting decisions. They avoided taking Baltimore because Ariel is a Ravens fan (the bet would have won). Jon suggested betting against his team, the Dolphins, which Ariel jokingly called "an emotional hedge". The Dolphins won. So they cost themselves two potential wins due to their fandom.
They decided not to take a bet on Houston (which ended up winning) because, in Jon's words, "betting on Davis Mills is not a pleasant experience". Whether a team or player was fun to bet on came up a couple of other times as well. Someone just trying to make a profit wouldn't care how fun the games are to watch. They might not even watch the games at all. Whether the gambler watches the game or not has no influence on the outcome.
Bets need to be fun, not just a good value. These gambling experts still want to experience "the sweat" -- watching the game and rooting for their bet to win. As I wrote last week, betting on the Browns and losing is like losing twice, so even if the Browns are a better value, they are a bad pick for emotional reasons. Who wants to have to be a Browns fan, if only for a few hours?
It's sort of like Levi-Strauss said about food. It's not enough that a type of food is good to eat, it must also be good to think about. The Houston Texans led by Davis Mills are not "bon à penser".
Not enough useful disagreement
All three of the bets they were in total agreement on (PIT, TB, ARI) lost. Nobody presented a case against those bets, so there was no opportunity for any of them to change their minds or reconsider their beliefs.
I'm not endorsing pointless contrarianism -- not every side needs to be argued. Don't be that one guy in every intro to philosophy class. But if both sides of an issue (or a bet) have roughly equal chances of being true, there should be a compelling case to be made for either side. Someone who can't make both cases fairly convincingly probably doesn't know enough to say which case is stronger.
Two types of hot streaks
For gamblers, there's one type of hot streak that's always bound to end. A team has won a few games it shouldn't have won, therefore they're bound to lose the next one. Their lucky streak will fail. In the real world, there's no invisible hand that pulls things down to their averages on a set schedule. In a small sample size of 17 games in an NFL season, there's no reason to think things will be fair by the end, much less the very next game. Now, a team could be overvalued by the market because they got some lucky wins, which makes them a value to bet against. But teams don't have some fixed number of "lucky games" every year, and once they've burned through those, their luck has to turn.
The other type of hot streak is bound to keep going. The team were divided whether to bet the Rams or not. They decided to go with Ariel's opinion, because she's been on a hot streak lately. If Ariel's record was demonstrably better than the other two hosts' over a long period of time, it would make sense deferring to her as the tiebreaker. But winning a few bets in a row doesn't mean the next bet is any more likely (or less likely) to win. As a teammate, that's a supportive thing to do, so I'm sure that's part of it. But people who gamble tend to think they have it sometimes, and don't have it other times. Sometimes they're hot, sometimes they're cold.
We've seen this before with NBA basketball. Basketball players have an innate tendency to believe in the hot hand, even though it doesn't exist, so much so that it actually hurts their performance.
Why would the hot hand exist when it comes to predicting the future? What laws of physics would allow someone to predict the future better at some times rather than others? A gambler, regardless of skill level, will occasionally have hot streaks or cold streaks based on chance alone. So a gambler on a hot streak shouldn't change what type of bets they take, or how much they wager, just like NBA players shouldn't change what type of shots they take. But they do.
The problem with props
They suggested a bunch of prop bets. 5 of the 6 suggested were overs -- bets on players scoring at least one touchdown, or going over a certain number of yards. 4 out of 5 of the overs lost.
Gamblers greatly prefer betting the over on prop bets, which creates a problem. There's little to no money wagered on the under, which means gamblers taking the over are betting against the house, not other gamblers. That should be a warning sign. Sportsbooks are rational economic engines. If they're taking on more risk in the form of one-sided bets, they're going to want more reward in the form of a higher profit margin.
For a lot of prop bets, the big sportsbooks don't even allow taking the under. If a gambler can bet both sides, at least we can calculate the overround, or profit margin on the bet. With one-sided bets like these, there's no way to know how juiced the lines are (my guess would be to Buster Bluth levels.)

Traditionally, a sportsbook wants to have equal action on both sides of a bet. They don't really care what the line is. As long as the money's basically even (they have made a book), they can expect to make money no matter which team comes out on top.
With these one sided prop bets, there's no way for the free market to move the price by people betting the under instead. So the line doesn't need to be that close to the actual odds. Without action on both sides, sportsbooks have to be extremely vigilant about never setting an inaccurate line that gives the over too much of a chance of winning. And I don't think that gamblers taking overs on prop bets are too price sensitive. So the sportsbooks have multiple reasons to make the overs a bad deal.
Even sportsbooks that offer unders charge a huge amount of vig on prop bets to offset the additional uncertainty to the sportsbook. There are so many prop bets on each game relative to the number of people who take them. They can get away with setting the lines algorithmically because the lines don't need to be all that accurate with a bunch of extra juice on top.
This screenshot is from an offshore "reduced juice" sportsboook that allows bets on the unders.
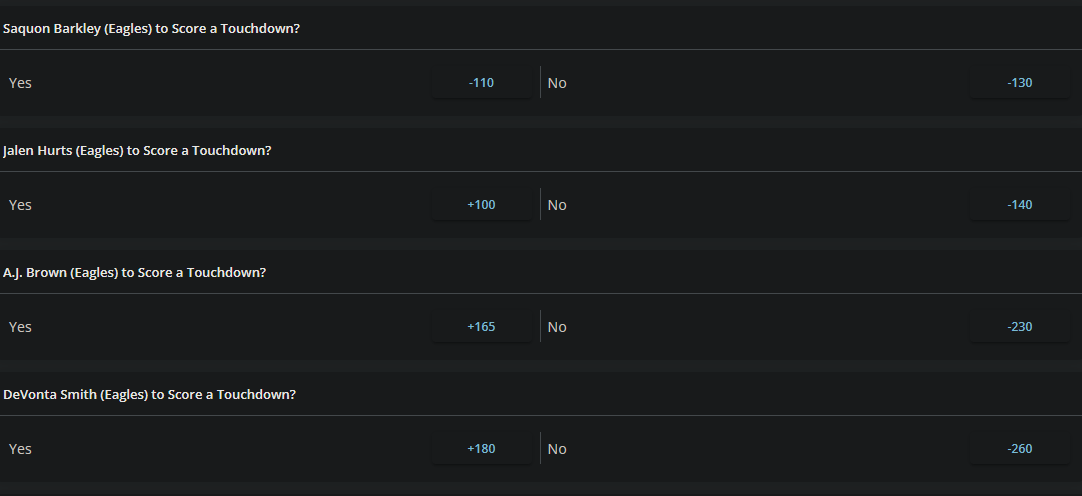
We can convert the lines to win probabilities and add them up to calculate the overround, as covered a couple of articles ago.
For the Saquon Barkley bet, the overround is 8.9%. For Hurts it's 8.3%, for Brown it's 7.4%, and 7.9% for Smith.
The overround for a normal spread bet is 4.5%. We saw it's about the same with NBA money lines. Because this book is reduced juice, overrounds on spread bets are around 2.6% -- for instance odds of -108/-102 or -105/-105 instead of -110/-110.
Prop bets have 2x the juice of a traditional spread bet, and over 3x reduced juice. That requires the gambler to win far more often just to break even.
Ways to potentially reduce bias
I've previously written about an experiment that showed gamblers tend to take the favorite, even when they've been told it's a worse bet than the underdog. That wasn't true of the Ringer teams last week. They only took 11 favorites out of 25, so they didn't show that particular bias. But I think the experiment gives a hint how to reduce bias in general.
The researchers found that people could be corrected of their bias towards favorites by writing out what they thought the lines should be before seeing what the lines were. It causes the person to actually try and do the math problem of whether the bet is a good investment or not, rather than anchoring on the price set by the market, and picking the better team, or the conventional wisdom.
It would be interesting to try having each team member decide what the fair line was, then average them out. Do predictions made that way perform better?
Similarly, it would be helpful to convert any odds from the American style (like +310, or -160) to the equivalent probability. People who have gambled a lot might have an intuitive sense of what -160 means, but for me, the equivalent 61.5%, or "about 5/8" is much clearer. I can imagine a large pizza missing 3 of the 8 slices.
Betting jargon and betting superstitions should be avoided. Does each bet make sense as a financial transaction? Personal feelings and the enjoyability of the bet shouldn't factor in. The quality of the game and who is playing in it shouldn't matter.
The bottom bun
Despite not being a gambler, the gambling podcasts I listened to were fairly enjoyable. It's basically Buddies Talk About Sports, which is a pleasant enough thing to have on in the background. Nobody would listen to Casey's Rational Betting Show, for multiple reasons.
The Mathletix Bajillion, week 2
The Ringer crew had a good week, collectively going 14-11 (56%). One team out of five is now in the green. mathletix still won the week, winning 60% of our bets.
As a reminder, one set of picks is generated algorithmically, the other randomly. I'll reveal which one at the end of the competition.
"line shopping" refers to how much money was saved, or extra money was gained, by taking the best odds available instead of betting at a retail sportsbook.
All lines as of Friday morning.
The Neil McAul-Stars
last week: 5-0, +504
line shopping: +4
- LAC -3 +100 (prophetX)
- TB +5.5 +100 (lowvig)
- MIN -3 +105 (lowvig)
- ARI +3 -101 (prophetX)
- SEA +3.5 -111 (prophetX)
The Vincent Hand-eggs
last week: 1-4, -334
line shopping: +6
- LAR -3 -110 (hard rock)
- SF -3 -101 (prophetX)
- DET +2.5 +100 (lowvig)
- TEN +6 -107 (prophetX)
- GB -7 -105 (prophetX)
Nov 07, 2025
Song: Charlie Musselwhite, "Cristo Redentor"
Are betting experts any good at what they do?
These days, nearly all talk about gambling I see on TV and the internet is sponsored by one of the sportsbooks. How good is all this sponsored advice?
There are quite a few shows that are just about gambling, but more common are ad reads from Youtubers or sportscasters who are sponsored by sportsbooks, but aren't really focused on gambling. These appear on-air in the middle of a game, or an ad break in a Youtube video.
Picks from sports announcers do terribly, as the Youtube channel Foolish Baseball has documented in their wonderful video, Baseball is Ruining Gambling.
As a numbers guy, it's baffling that anybody would follow these obviously sponsored picks at obviously juiced lines, given by obviously casual gamblers, but some people are taking them, because the sportsbooks keep paying for the ads.
Gambling is a social and parasocial activity now, another thing you do on your phone when you're bored that sort of feels like interacting with other humans, but isn't.
Some gamblers want to be on the same side of the bet as their favorite YouTuber, who give their favorite picks as a part of an ad read. The apps also allow you to follow people, and take the same bets they take. It's yet another one-way online relationship.
Other gamblers take bets to feel more connected to their team. Announcer parlays are invitations to take a financial interest in the game that you're already watching, not necessarily because you think the Brewers play-by-play guy is secretly a betting wizard. The baseball announcers don't seem to have much of an interest in gambling, or being touts. They're not there for our wholesome national pastime, gambling on sports, they're true sickos who are only interested the disreputable game of baseball. Putting together some half-ass parlay for the promo is part of their job. It's just another ad read. It may as well be a local roofing company or a personal injury lawyer.
Sportsbooks advertise because it makes them money in the long run. These companies seem pretty well-run, if nothing else. They want to sponsor people who are good at bringing in customers with a high Customer Lifetime Value -- people who will lose over and over again for years, making back the cost to acquire them as a customer many times over. That's it. That's the game. Why would they sponsor people who give good advice about gambling, or good picks?
Do people care whether gambling experts are actually good or not?
Some guys talk about gambling for a living. They discuss sports from the perspective of people who are gamblers first, and sports fans second. Everything's an angle, or a trend, or a bad beat. At the extreme, athletic competitions are interesting because betting on them is interesting, not because sports themselves are. These guys are both living and selling the gambling lifestyle, which I talk much more about in the book:
A parasocial relationship with a guy selling picks or talking about gambling on a podcast causes guys to want to form social relationships around gambling. They're Gambling Guys now. Which leads to an endless parade of dudes complaining about their parlays online, and, I would wager, annoying the heck out of their significant others. "It's a whole lifestyle, Sherri! Of course I had to get my tips frosted! I'm a Gambling Guy now!"
It's all imaginary. An imaginary relationship with a betting guru in the form of a "hot tip". An imaginary relationship with the sporting event or player in the form of a bet. An imaginary relationship with reality itself in the form of the rationalization about why the "hot tip" didn't win. An imaginary relationship between winning and skill.
Being a sports fan is already ridiculous enough.
Poking the bear, a bit
The Ringer is a website about sports and pop culture that has evolved into a podcasting empire. I like a lot of what they do, and I especially appreciate that they publish great writing that surely isn't profitable for the company. For the most part, I can just enjoy their non-gambling content and ignore that it's subsidized by gambling.
But they've done as much as anyone to normalize sports betting as a lifestyle, and deserve an examination of that. The Ringer wasn't worth a bajillion dollars before gambling legalization, back when they were doing MeUndies ad reads.
The Ringer has an incredible amount of content that's just Gambling Guys Talk Gambling with Other Gambling Guys, around 10 hours a week of podcasts, by my count. The Ringer's flagship show is the Bill Simmons Podcast, which usually devotes at least a couple hours a week to discussing which bets Bill and his pals think are good. (Previously satirized in Cool Parlay, Bro)
The site also has an hour long daily podcast about gambling, The Ringer Gambling Show, and several other podcasts that regularly discuss betting. As far as I know, all of their sports podcasts feature gambling ad reads, even the ones with hosts that clearly find gambling distasteful.
Several members of the Ringer's staff are full time Gambling Guys now. They talk about their addictions for a living, which must be nice. I've been talking about my crippling data science addiction on here for months without a single job offer.
Are these guys good at their job, though? (Are they good at their addictions?) The Ringer is currently having a contest betting on the NFL between five different NFL podcasts, four of which primarily cover sports gambling, which they're calling The Ringer 107. Here are their results through Week 9:
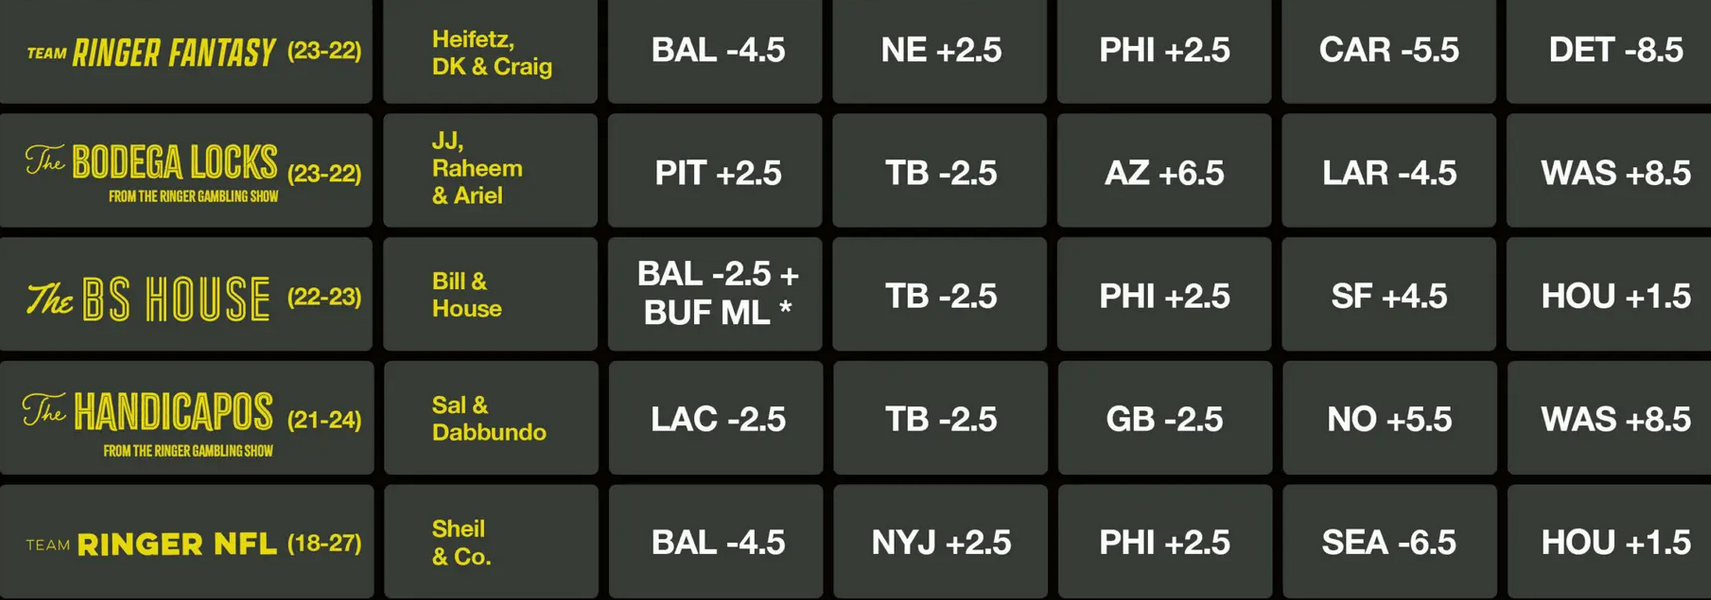
Every single one of the five teams is losing money against the spread. They don't make it clear on the website, but some bets are at -120 vig, so the records are even worse than they look.
It might be bad luck, right? I've written at length about how having a true skill level of 55% doesn't guarantee actually winning 55% of the bets.
Based on this data, it's extremely unlikely the gambling pros at the Ringer are just unlucky. I simulated 5 teams taking the same number of bets as the Ringer's contest so far. If every pick had a 55% chance of winning (representing picks by advantage players), then 99.5% of the time, at least one team does better than all five of the Ringer's did.
Even at a 50% winning rate, same as flipping a coin, the simulation does better than the Ringer 91% of the time. Based on this data, you'd be better off flipping a coin than listening to these gambling experts.
The easiest way to know they can't do it
If I talked about gambling for a living and was demonstrably good at it, I'd want everyone to see the proof. These guys almost never post their actual records over a long stretch of time, though. They will crow about their wins, and offer long-winded explanations as to why their losing picks were actually right, and reality was wrong. But it's hard to find actual win-loss records for them.
Last season, The Ringer's Anthony Dabbundo didn't appear to keep track of his record betting on the NFL against the spread at all (example article). This year, he has, so we know he's gone 37-37, and 20-25 on his best bets, despite some of them being at worse than -110 odds. His best bets have had a return of -16.7%, about the same as lazy MLB announcer parlays, and almost 4 times worse than taking bets by flipping a coin.
What odds would you give me that the Ringer goes back to not showing his record next season?
To be clear, I don't think Dabbundo is worse than the average gambling writer at gambling. I've never found a professional Gambling Guy that is statistically better than a coin flip. Dabbundo's job is writing/podcasting the little descriptions that go along with each of his picks. His job isn't being good at gambling, it's being good at talking about gambling. There is no evidence that he can predict the future but plenty of evidence he can crank out an hour of podcast content every weekday that enough people enjoy listening to. Predicting the future isn't really the value-add for these sorts of shows.
The curse of knowledge
I think it's significant that by far the worst team in the contest is the Ringer NFL Show, which is primarily not about gambling. It's a show by extreme football nerds, for extreme football nerds. Once in a while I listen to it while doing the dishes, and I'll go like 20 minutes without recognizing a single player or football term they're talking about. They are all walking football encyclopedias, as far as I'm concerned.
If gambling really were a matter of football-knowing, they should be winning. They aren't, because betting isn't a football-knowing contest.
I can see how being a true expert might make somebody worse at gambling. Every bet is a math problem, not a trivia question. A bet at a -4.5 spread might have a positive expected value, but a -5.5 spread have a negative expected value. People who are good at sports gambling can somehow tell the difference. Like life, sports gambling is a game of inches.
The folks on the Ringer NFL Show know the name of the backup Left Tackle for every team in the league, but I don't think that's really an advantage in knowing whether -4.5 or -5.5 is the right number for a particular game. Most of the cool football stuff they know should already be baked into the line, or is irrelevant. Sports betting is a lot more like The Price Is Right than it is like sports.
A great chef might know practically everything there is to know about food. They might know what type of cheese is the tastiest, how to cook with it, and so on. But if they went to the grocery store, that doesn't mean they would notice that they had gotten charged the wrong price for the cheese, or that they could get it 20% cheaper at another store. That's a totally different skillset and mindset.
People on these gambling shows spend several minutes explaining each of their picks, listing lots of seemingly good reasons. I think that having to give a good reason for each pick forces them into going with what they know, not considering that all the obvious information and most of the non-obvious information they have is already reflected in the line. Needing to be seen as an expert could lead them to pick the side with slightly less value on it, because they want to make a defensible pick. It's much better to have a good sounding reason for making a pick, and losing, than it is to have no reason for making a pick and winning.
In general, I think every bet has a more reasonable side and a crazier side. Anybody prognosticating for a living has a disincentive to pick the crazier side if they're going to have to explain the bet if they happen to lose. It doesn't if there was actually more value than the Browns. Losing on the Browns and then having to live with being the guy who bet on the Browns is two losses at once.
The Mathletix Bajillion, week 10
I figured I should take a crack at it. The season is mostly over, so it will be a small sample size, but let's see what happens. At the very least, it will force me to publish something at least once a week for the next couple of months, and if things go bad, work on developing the shamelessnesss of someone who gets paid to predict the future, even though they can't.
I'm going to make two sets of picks, one based on a proprietary betting model I created, the other purely random, based on rolling dice. At the end, I will reveal which team is which, and see how they do against the Ringer's teams.
I am an extremely casual fan of the NFL, so little to no actual ball-knowing will go into these picks. I probably know less about football than the average person who bets on football. I don't think that's really a disadvantage when the football experts are going 18-27 on the year.
I will take all bets at -110 odds or better. No cheeky -120 bets to goose the win-loss record a bit, like some of the teams in the Ringer competition have done. But I will also shop around between sportsbooks and take the best lines I can find, by checking sites like unabated, reduced juice sportsbooks like lowvig and pinnacle, and betting exchanges like matchbook and prophetx.
For the betting exchanges, I will only take spreads where there is at least $1000 in liquidity -- no sniping weird lines. Part of what I'm trying to show is that bargain shopping, which has nothing to do with football knowledge, can make a big difference. So I will shop pretty aggressively. Even if I lose, I will lose less fake money than I would at -110, which means I don't have to win as often to be profitable. I'm pretty confident I can beat the Ringer pros on that point at least.
Sources will be noted below.
Team names come from the 1995 crime drama Heat, starring Tom Sizemore, in accordance with the Ringer house style.
Picks were made Friday evening.
The Neil McAul-Stars
- ATL +6.5 -108 (fanduel)
- NO +5.5 -109 (prophetx)
- SEA -6.5 -110 (prophetx)
- PHI +2 -109 (Rivers)
- LAC -3 +104 (prophetx)
The Vincent Hand-eggs
- DET -7.5 -105 (prophetx)
- PIT +3 -109 (prophetx)
- TB -2.5 -110 (fanduel)
- CHI -4.5 -105 (fanduel)
- CAR -5 -110 (harp rock casino)
Nov 05, 2025

Song: Geraldo Pino, "Heavy Heavy Heavy"
Code: https://github.com/csdurfee/scrape_yahoo_odds/. See the push_charts.ipynb notebook.
NBA Push Charts
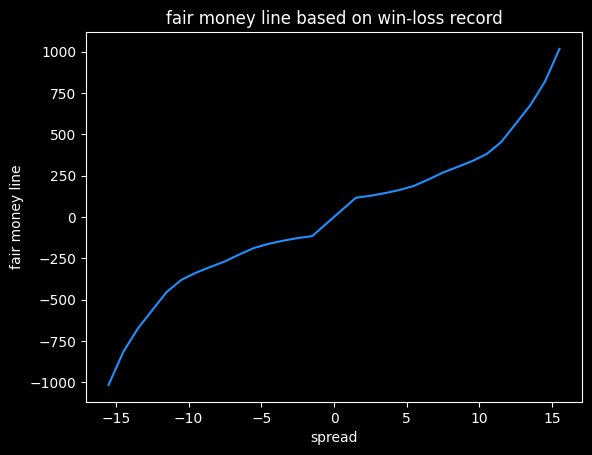
In the past couple of posts, I've looked at NBA betting data from BetMGM. There are multiple types of bets available on every game. A push chart maps the fair price of a spread bet to the equivalent money line bet. How often does a team that is favored by 3 points win the game outright? It's going to be less often than a team favored by 10 points. The money line should reflect those odds of winning.
You can find a lot of push charts online, but they tend to be based on older NBA data. With more variance due to a lot of 3 point shots, and more posessions per game, I wouldn't expect them to still be accurate.
Push charts are useful for assessing which of two different wagers is the better value. Here's an example of a game where different sportsbooks have different lines for the same game:
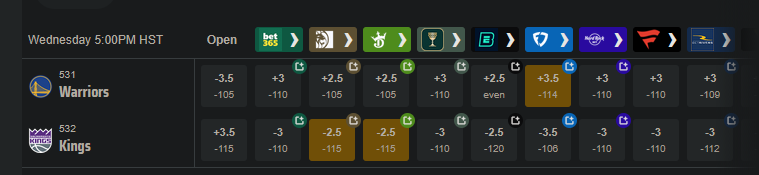
Say you want to bet on the Warriors. They have some players out tonight (Nov 5, 2025) so they're the underdogs, but they are also playing the dysfunctional Kangz, so it might be a good value bet. You could take the Warriors at either +3.5 -114, +3 -110, or +2.5 -105. Which bet has the highest expected value? If the Warriors lose by 3, the +3.5 bet would win, but the +3 bet would push (the bet is refunded), and the +2.5 bet would lose. A push chart can give a sense of how valuable the half points from +2.5 to +3, and +3 to +3.5, are. Is the probability of the Warriors losing by exactly 3 -- the value of getting a push -- worth going from -105 to -110?
[edit: the Warriors, without their 3 best players, led for most of the game before eventually losing by 5 after Russell Westbrook had one of his best games in years. So the line was only off by 2 points. The lines are often uncannily close, even when a bunch of weird stuff happens. Sometimes it all kinda cancels out.]
I'm going to do a push chart two different ways, then combine them. For almost every game over the last 4 years, we have the money line and the spread, so we can match them up directly. These will have the vig baked in. And as we saw previously, the money line for favorites has a slightly better expected value than the average bet on the spread. So it's going to end up a little biased.
We can also calculate a push chart without any vig by looking at winning percentage for every spread -- what percent of the time does a +3.5 point underdog actually win the game. It will need some smoothing, since the data will be noisy.
The retail NBA push chart
I matched up the spread and the money line for both the home and the away team on each game, then took the median of those values. Spreads in the range of -0.5 to +0.5 are very rare, as are spreads over -13.5/+13.5, so I've omitted those.
|spread |money line|
|------:|---------:|
| -13.5 |  -1000   |
| -12.5 |   -750   |
| -11.5 |   -650   |
| -10.5 |   -550   |
|  -9.5 |   -450   |
|  -8.5 |   -375   |
|  -7.5 |   -300   |
|  -6.5 |   -250   |
|  -5.5 |   -225   |
|  -4.5 |   -190   |
|  -3.5 |   -160   |
|  -2.5 |   -140   |
|  -1.5 |   -120   |
|   1.5 |    100   |
|   2.5 |    115   |
|   3.5 |    135   |
|   4.5 |    155   |
|   5.5 |    180   |
|   6.5 |    200   |
|   7.5 |    240   |
|   8.5 |    290   |
|   9.5 |    340   |
|  10.5 |    400   |
|  11.5 |    475   |
|  12.5 |    525   |
|  13.5 |    625   |
This gives us how BetMGM prices the value of individual points on the spread (with the vig figured in). This is sort of their official price list.
American style odds are symmetrical if there is no vig involved. A -400 bet implies a 4/5 chance of winning, and a +400 bet implies a 1/5 chance of winning. If the -400 bet wins 4/5 of the time and loses 1/5 of the time, the gambler breaks even, and vice versa. So a no-vig money line would be +400/-400.
The odds offered by the sportsbooks are asymmetrical, because they want to make money. We see that +13.5 on the spread maps to a +625 money line, but -13.5 maps to -1000. A +625 bet should win 100/(100+625), or about 14% of the time. A -1000 bet should win 1000/1100, or 91% of the time. Adding those together, we get 91% + 14% = 105%. That extra 5% is called the overround, and is the bookmaker's guaranteed profit, assuming they have equal wagers on both sides.
Here's what that data looks like as a graph, with some smoothing added.
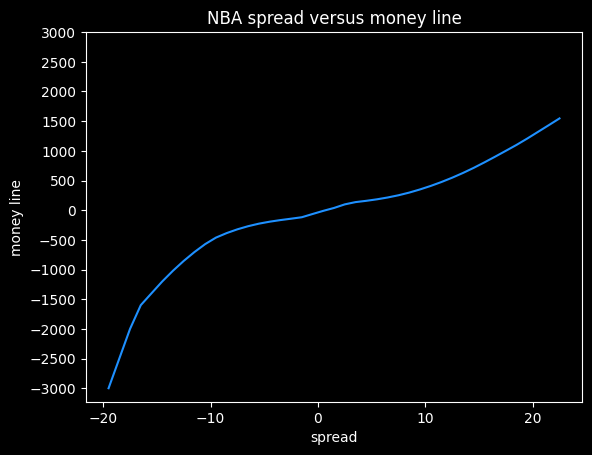
I think this shows the bias against heavy favorites that we saw previously. Note how the line gets much steeper moving from -10 to -20 on the spread, versus moving from +10 to +20.
At -20.5, this graph gives a payout of -5000, but at +20.5, it gives a payout of +1320. The fair payout is somewhere in between those two numbers.
If the fair payout is (-5000/+5000), then the underdog is getting way less of a payout (in essence, paying more in vig) than they should. If the fair payout is closer to (-1360/+1360), then the favorite is paying more in vig than they should. So the asymmetricality gives a clue that sportsbooks aren't splitting the vig down the middle, but it doesn't tell us the fair price.
Push charts based on win frequencies
We can estimate a fair price by going through all the games and see how often a +3.5 underdog wins outright, then convert that percentage to a fair money line. The problem here is that the results will be very noisy. We'd need hundreds or thousands of games at each spread value, and we only have 4,500 or so games overall. So it's gonna be chunky. We'll have to do some smoothing on it, (foreshadowing alert: it will lead to weird results later on)
Here are the win ratios by spread, combining both home and away teams:
| spread| win ratio |
|------:|----------:|
| -13.5 | 0.889764  |
| -12.5 | 0.835616  |
| -11.5 | 0.832487  |
| -10.5 | 0.789474  |
|  -9.5 | 0.747212  |
|  -8.5 | 0.762763  |
|  -7.5 | 0.745763  |
|  -6.5 | 0.701299  |
|  -5.5 | 0.643892  |
|  -4.5 | 0.6       |
|  -3.5 | 0.641682  |
|  -2.5 | 0.562393  |
|  -1.5 | 0.525535  |
|   1.5 | 0.474465  |
|   2.5 | 0.437607  |
|   3.5 | 0.358318  |
|   4.5 | 0.4       |
|   5.5 | 0.356108  |
|   6.5 | 0.298701  |
|   7.5 | 0.254237  |
|   8.5 | 0.237237  |
|   9.5 | 0.252788  |
|  10.5 | 0.210526  |
|  11.5 | 0.167513  |
|  12.5 | 0.164384  |
|  13.5 | 0.110236  |
A team with a -1.5 point spread wins 52.6% of the time, which is very close to the break-even point on standard -110 bets of 52.4%. So a gambler needs to be at least 1.5 points better than Vegas at setting the lines to expect to make money.
These odds have to be symmetrical. If a team favored by -4.5 wins 60% of the time, then a +4.5 point underdog has to win 40% of the time.
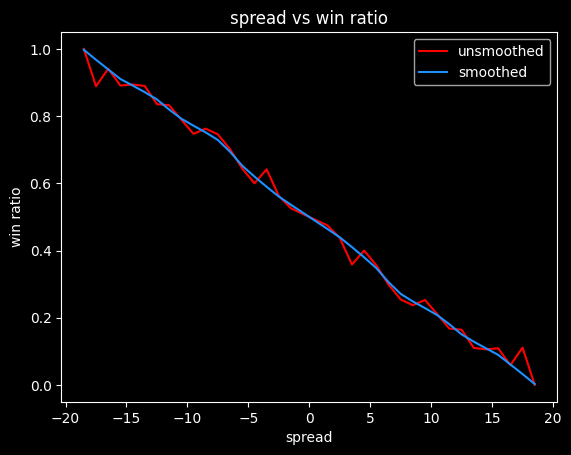
Unfortunately, this data is probably too chunky to give good results. -4.5 has a lower win rate than -5.5, which doesn't make any sense. The more negative the spread, the higher the win rate should be. Here's what it looks like with smoothing:
We can convert these winning percentages to fair (no vig) money lines:
Converting to money lines doesn't break the symmetry. A -4.5 favorite gets a money line of -163, and a 4.5 point underdog gets a money line of +163.
This is just a first attempt. Different ways of smoothing the actual win rates will lead to different results.
|spread |fair ML |
|------:|-------:|
| -13.5 |   -677 |
| -12.5 |   -565 |
| -11.5 |   -454 |
| -10.5 |   -381 |
|  -9.5 |   -338 |
|  -8.5 |   -303 |
|  -7.5 |   -269 |
|  -6.5 |   -227 |
|  -5.5 |   -188 |
|  -4.5 |   -163 |
|  -3.5 |   -144 |
|  -2.5 |   -128 |
|  -1.5 |   -116 |
|   1.5 |    116 |
|   2.5 |    128 |
|   3.5 |    144 |
|   4.5 |    163 |
|   5.5 |    188 |
|   6.5 |    227 |
|   7.5 |    269 |
|   8.5 |    303 |
|   9.5 |    338 |
|  10.5 |    381 |
|  11.5 |    454 |
|  12.5 |    565 |
|  13.5 |    677 |
Crossing the streams, and an abrupt ending
What happens if we look at the difference between the no-vig moneylines, and what the sportsbook actually charges? Will it show us the favorite-longshot bias?
It turns out, it doesn't. The win frequency data is too noisy. I spent a lot of time spinning my wheels on it, before realizing I didn't have enough data. I will come back to the subject, though, because failure is more educational than success.
Oct 26, 2025

Song: Pigeonhed, "Glory Bound" (Dave Ruffy Remix)
Code: https://github.com/csdurfee/scrape_yahoo_odds/
A little crowd wisdom
Last week, we saw that for NBA spread bets, the more popular side wins 49.2% of the time. This matches what I've shown before -- the public is generally worse than a coin flip when betting on NBA basketball.
This week, I have some good news. There are some types of bets on the NBA where the public do a little better than expected. Not enough to make money, but better than picking bets by flipping a coin.
Money line bets and rationality
Last time, I looked at money line bets and showed that there is a bias against slight to heavy underdogs, and a possible bias against very heavy favorites. There's a lot I didn't get to, though. What kind of money line bets do the public prefer?
The public takes the home team 63% of the time, which is a little high given the home team wins 55% of games. The public also takes the money line favorite in 96% (4656/4839) of NBA games.
Is that rational or not? We know that favorites are a slightly better deal than underdogs on the money line, so in one sense it is. If someone offered you a free money line bet on the NBA, you should probably pick the favorite. The expected value is less bad than the underdog, so it's a better choice in the long run, and your chances of making some money on the bet are much higher, so it's perhaps a better choice as a single bet as well.
A gambler taking half favorites and half underdogs has a chance at winning 100% of their bets, but someone taking a highly imbalanced number of favorites (or underdogs) will have a whole lot of guaranteed losses. The gambler might correctly pick every single favorite, but close to half of their bets on favorites are still going to be losses.
Getting pigeonholed
Money lines are all at different odds, which complicates things. For this example, let's say the gambler is taking spread bets, with both sides having a roughly equal chance of winning. There are 1230 games in the season, we'll assume the favorite is a slightly better deal, so wins 51% of the time, and the gambler takes the favorite 96% of the time. Over 1230 games, the favorites go 627-603. The gambler takes 1181 favorites and 49 underdogs on the season.
The best they can possibly do on favorites is 627/1181 (53%), assuming they somehow manage to correctly bet on every single favorite that won that season. The gambler captured all of the favorites that won, so the rest of the games left over are underdog winners, meaning they'd go a perfect 49/49 in underdog games. Overall, the best they can do is (627+49)/1230, which is 54.9%. Since the break-even point is 52.4%, most of the profits are coming from the 49 underdog games.
By taking so many favorites, the pigeonhole principle means the gambler has to be perfect just to hit a 54.9% win rate. As I showed in Do you wanna win?, 54.9% is good enough to have a positive expected value on bets, but it's low enough that losing money over 1,230 bets is very possible, even with proper bankroll management. If hitting that number requires you to be perfect, it seems like a bad plan.
Here are the frequencies of odds taken by the public on the money line. There's an awkward gap in the middle. In the American way of writing odds, favorites are always -100 or smaller, and underdogs are always +100 or bigger.
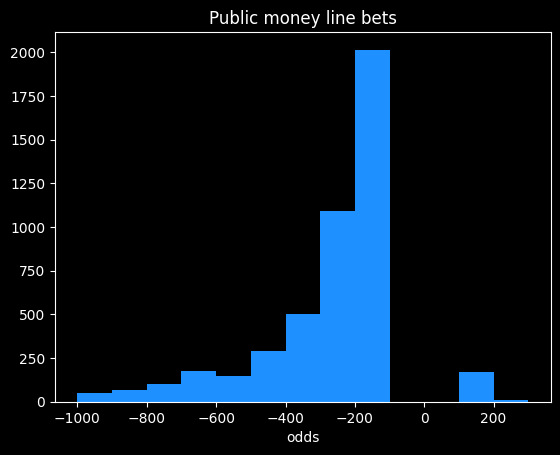
The public mostly takes bets in the -100 to -300 range, which is in the range where money line bets have been a slightly better value than spread bets over the past four seasons, so good for them. The biggest underdog bet the public took in nearly 5,000 bets was at +400 (implying the underdog had a 20% chance of winning.)
The public achieved -2.87% rate of return on money line bets. That's bad compared to the 0% rate of return offered by not betting, but it's better than the -4.5% on spread bets, and way better than the -20% on some types of parlay bets. Someone fading, or taking the opposite bets to the public, would achieve a -6.4% rate of return.
On the rare occasions the public does take the underdog, they make a profit. On those 183 bets, the public notched a +2.43% rate of return. Bets on underdogs will have a high amount of variance, so there could be some luck involved.
Point totals
In addition to who will win the game, gamblers can wager on how many total points will be scored. For instance, if the final score is 120-115, the point total would be 235. If the line was 230, the OVER side would have won, and the UNDER lost.
The point totals are pretty balanced. The over wins 50.6% (2672/5273) of the time. However, the public takes the over 88.3% (4660/4839) of the time.
The public did a little better than a coin flip, winning 51% of over bets, and 54.5% of the 178 under bets.
I was curious whether the percent of bets on one side was correlated with higher winning percentage. If 99% of the public took the over, is that a safer bet than if only 51% of the public took it? I've broken down the public's bets on the over by quartiles:
| start % |
end % |
num games |
win % |
| 50 |
73.9 |
1165 |
50.5% |
| 73.9 |
82.4 |
1164 |
51.4% |
| 82.4 |
88.4 |
1163 |
50.9% |
| 88.4 |
100 |
1168 |
51.5% |
For 1,000 observations, a 95% confidence interval is roughly +/- $\frac{1}{\sqrt{1000}} \approx \frac{1}{\sqrt(33*30)} \approx 3\%$, which is much bigger than the difference between 50.5% and 51.5%. So the difference isn't significant.
Are sportsbooks leaving money on the table?
It's odd to me that the over would win more than 50% of the time when that's the side that usually has the most money on it. That's not a huge imbalance, but the sportsbooks would be making more money if they increased the point totals a bit so the over loses 51% of the time instead.
Gamblers betting on point totals are probably a little more savvy than ones betting the lines. It's kind of an odd thing to bet on. Doesn't matter who won, doesn't matter whether it was a good game or not. All bets are math problems, but point totals are more obviously a math problem than money lines or spreads.
Do point totals tell us anything about the evolution of the NBA?
It's possible sportsbooks haven't kept up with the evolution of the game. NBA point totals have gotten much higher over the past decade due to faster pace, better shooting and more 3 pointers.
Here is a graph of moving averages of the point totals for the past four seasons:
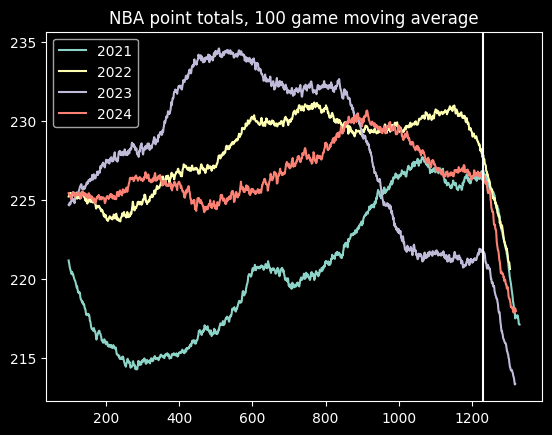
Point totals go down at the end of every year. That's because playoff games tend to be more tightly contested than regular season games. The vertical line is where the playoffs start.
There appears to be an increase in average point totals during the 2021 season, but it's stayed fairly consistent since then, with one notable exception. There's an big dip in point totals during the 2023 season, around game 800. This is almost certainly due to a directive from the NBA telling officials to call fewer fouls. Fans (and presumably gamblers) noticed right away, but the NBA only admitted the change well after the fact. Luckily, nothing has happened since then to further undermine trust in the NBA!
Oct 19, 2025

Song: The Meters, "People Say"
In a previous installment, I looked at statistics about NBA gambling that I obtained from sportsbookreview.com. I thought it was pretty interesting, but there were some huge gaps in the data, and I wasn't sure what sportsbook some of it was coming from. So I didn't have a ton of confidence in my results.
I thought it was a pretty cool idea, though, so I tracked down a better source of data via Yahoo's NBA pages. Yahoo loads gambling data from the BetMGM sportsbook, and I found a nice internal API for getting it all. I was able to get data on the past four seasons of NBA games, and although data is missing for some games, it's much more complete, and has a bunch more info, than the original dataset.
All code and data is available online at https://github.com/csdurfee/scrape_yahoo_odds/. The explore.ipynb notebook has all the calculations and charts used in this article.
As usual with gambling content, I'm presenting this data because I think it is interesting to study how it works, and what it tells us about basketball and human nature. I don't recommend you bet based on information in this article, or at all.
The data I'm looking at is every regular season and playoff NBA game from the 2021-22, 2022-23, 2023-2024 and 2024-2025 seasons. No preseason games or All-Star games, but the Emirates NBA Cup championship game is included.
There are 435 games that are missing stake/wager data (the percentage of money and bets placed on each side, respectively.) That leaves 4,840 NBA games that I have analyzed. The stake and wager percentages seem to be pretty similar to each other, so I'm just using the wager data.
What do the spreads look like? Are there any obvious biases?
The home team went 2393-2447 (49.5%) against the spread over the last 4 years. The favorite team went 2427-2413 (50.1%) against the spread in that time.
The home team was the favorite in 3044/4840 (62.8%) of games. The median spread is the home team -3.5 (favored by 3.5 points). Here are the frequencies:
Basketball games never end in a tie, and there are strategic reasons why NBA games rarely end in a one point difference.
Around half of all home lines are one of -2.5, -1.5, -4.5, -3.5, +1.5, -6.5, -5.5, -7.5 or +2.5 (in descending order of frequency).
98.3% of all MGM lines are on the half point (eg 8.5 instead of 8). This is so the sportsbook can avoid pushes (ties), where they have to give everybody's money back.
More evidence of the folly of crowds
First, some betting jargon, if you're new here. Teams that are popular with bettors are known as public teams. The side of a particular bet that gets more action is known as the public side. If that side of the bet won, people say the public won. Betting the less popular side is known as fading the public. When the less popular side wins against the spread, people will say Vegas won or sharps won (a sharp is someone who is good at betting, as opposed to a square, who is bad at betting.)
Looking at the stake/wager data, we can find out which team was more popular to bet on for each game. How do those public teams do collectively? Are the public any better or worse at making picks than just flipping a coin?
Due to well-earned cynicism, I was expecting that the public would be a bit worse than a coin flip. And they are. The public went 2381-2459 (49.19%) against the spread over the past 4 years.
The public greatly prefer betting on the away team. 2742/4840 (56.7%) of public bets are on the away team. The public also greatly prefer favorites. 2732/4840 (56.4%) of bets are on them.
Here's how the bets break down:
|
favorite |
dog |
| AWAY |
1215 |
1527 |
| HOME |
1517 |
581 |
This crosstab is a little misleading. The home team is usually favored, so there are fewer home underdogs than road underdogs. However, there's still a discrepancy. The home team is the underdog 37% of the time, but only 27% of bets on underdogs are on the home team, and 28% of bets on the home team are on underdogs.
Of the 4 categories, the only one with a winning record for the public is away favorites -- 623-592 (51.3% win rate). The second best type is home underdogs, which went 289-292 (49.7%).
The two most popular bet types with the public are big losers. Away underdogs went 742-785 (48.6%), and home favorites went a putrid 727-792 (47.9%).
Overall, someone taking the public side of every bet over the past 4 years would have lost 324 units. If they bet $100 on every game, they would be down $32,400. Someone taking the opposite side of all these bets (fading the public) would "only" lose 160 units, or $16,000.
It would've been profitable betting reduced juice (risk 106 to win 100 instead of 110) to fade the public on all away underdog and home favorite picks. The problem with that strategy is that reduced juice sportsbooks actively attract smart players, so they have sharper (more accurate) lines. A retail sportsbook like BetMGM doesn't need sharp lines because they ban any players who win too much. Against sharp lines, I wouldn't expect the strategy to be profitable.
How have teams done against the spread over the past 4 years?
Over the past 4 seasons, team records against the spread appear fairly random. The only real outlier is the Oklahoma City Thunder, who have won an astounding 59.3% of their games against the spread. This is remarkable to me because they've been one of the best and most hyped teams in basketball the past couple years. They dominated the league last season, winning 68/82 (82.9%) games, and the NBA Championship. They're not exactly an under the radar team. Yet they appear to have been underestimated by both Vegas and the betting public.
|
|
| Oklahoma City |
0.593 |
| Toronto |
0.544 |
| Boston |
0.54 |
| Memphis |
0.529 |
| Orlando |
0.528 |
| Chicago |
0.516 |
| Dallas |
0.515 |
| Cleveland |
0.508 |
| New York |
0.504 |
| Golden State |
0.504 |
| Indiana |
0.503 |
| Houston |
0.502 |
| LA Lakers |
0.5 |
| Miami |
0.499 |
| Philadelphia |
0.498 |
| Minnesota |
0.496 |
| Detroit |
0.495 |
| Utah |
0.492 |
| Denver |
0.491 |
| Sacramento |
0.49 |
| LA Clippers |
0.489 |
| San Antonio |
0.488 |
| Charlotte |
0.487 |
| Milwaukee |
0.484 |
| Brooklyn |
0.483 |
| Portland |
0.477 |
| New Orleans |
0.476 |
| Phoenix |
0.471 |
| Atlanta |
0.442 |
| Washington |
0.439 |
While it's not impossible OKC's record against the spread is due to chance alone, a 59.3% winning percentage over 332 games seems like a failure of the market.
Who are the most common favorites?
Boston has been the most dominant, being favored in 319/361 (88.4%) of their games over the past four seasons, followed by Milwaukee, Denver and Golden State.
Detroit, Charlotte, Washington and San Antonio were the most common underdogs.
|
|
| Boston |
0.884 |
| Milwaukee |
0.734 |
| Denver |
0.711 |
| Golden State |
0.707 |
| Cleveland |
0.706 |
| Phoenix |
0.691 |
| Miami |
0.608 |
| Minnesota |
0.595 |
| LA Clippers |
0.588 |
| New York |
0.572 |
| Philadelphia |
0.568 |
| Memphis |
0.56 |
| Oklahoma City |
0.557 |
| Dallas |
0.542 |
| Sacramento |
0.535 |
| LA Lakers |
0.509 |
| Atlanta |
0.498 |
| Indiana |
0.456 |
| Chicago |
0.426 |
| Toronto |
0.414 |
| Brooklyn |
0.411 |
| Utah |
0.406 |
| New Orleans |
0.385 |
| Orlando |
0.358 |
| Houston |
0.309 |
| Portland |
0.245 |
| San Antonio |
0.215 |
| Washington |
0.213 |
| Charlotte |
0.194 |
| Detroit |
0.188 |
Who are the most common public teams?
We saw the public likes to bet on the away team, and the favorite. Do they have team-specific tendencies?
They certainly do. The LA Lakers and Golden State Warriors are most popular, being the picked by the public in 72% of their games. Detroit and Orlando are the least popular, only getting the majority of bets in 31% of their games.
|
|
| LA Lakers |
0.716 |
| Golden State |
0.716 |
| Milwaukee |
0.694 |
| Phoenix |
0.607 |
| Denver |
0.603 |
| Dallas |
0.577 |
| Boston |
0.557 |
| Memphis |
0.551 |
| Chicago |
0.545 |
| Indiana |
0.541 |
| Philadelphia |
0.538 |
| Cleveland |
0.52 |
| Miami |
0.519 |
| Utah |
0.518 |
| Oklahoma City |
0.518 |
| Minnesota |
0.504 |
| LA Clippers |
0.502 |
| Brooklyn |
0.497 |
| Atlanta |
0.495 |
| New York |
0.484 |
| San Antonio |
0.436 |
| Washington |
0.425 |
| Sacramento |
0.417 |
| Houston |
0.401 |
| Toronto |
0.382 |
| Charlotte |
0.359 |
| Portland |
0.341 |
| New Orleans |
0.322 |
| Detroit |
0.314 |
| Orlando |
0.311 |
This is a very similar ranking to what I saw in the previous data -- the public don't appear to be picking bets for purely rational reasons. They like to bet on popular teams, good teams, and teams with popular players. They don't like to bet on unpopular or bad teams, even though both sides have the same chance of winning against the spread. It makes sense as an aesthetic choice, but not as a mathematical choice.
There is a bit of correlation (r = .08) between team popularity and their record against the spread. Bettors do slightly prefer to bet on teams that do well against the spread:
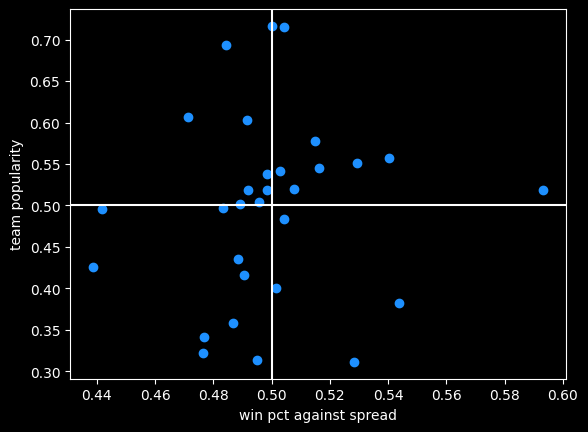
Oklahoma City is that lonely dot far off to the right, far better than every other team but only slightly more popular than average.
Money lines and the favorite/longshot bias
So far I've only been looking at bets against the spread. This new dataset also includes info on money line bets.
In some ways, money line bets are easier to understand -- just bet on the team you think will win. If you like the favorite, you will win less than you risk; if you like the underdog you win more than you risk. If it's say Oklahoma City versus Dallas, the two sides might be OKC -320 (risk $320 to win $100, implying about a 75% chance of winning) and DAL +260 (risk $100 to win $260).
With spread bets, both sides have an equal chance of winning, and are usually priced the same. But with money lines, the gambler doesn't know the true odds, so they don't know the vig they're paying.
There is data to suggest that underdogs pay more in vig, and are therefore more profitable for the sportsbook. This is called the favorite-longshot bias -- conventional betting wisdom is the expected value of taking an underdog money line bet (especially a big underdog) is lower than taking the favorite. People who bet the underdog are in essence paying a premium to have a more thrilling outcome if they do win.
While it's a documented phenomenon in horse racing, there's some debate as to whether it exists in general, so I analyzed the 4,634 games with money line betting data.
If somebody always bet the favorite on every NBA game, or the underdog, what would be their rate of return? Is it better or worse than the -4.5% rate on spread bets?
I did find evidence of the favorite-longshot bias in the NBA money lines. When risking a constant amount of money on each bet, underdogs had a rate of return of -5.47% versus -4.09% for favorites. Favorites between -200 and -400 offer the best rate of return of any type of money line bet, at -2.97%. Every single type of underdog bet does worse than -4.5% of the typical spread bet.
| label |
start |
end |
num games |
return % |
| all faves |
-9999 |
-1 |
4839 |
-4.09% |
| mild faves |
-200 |
-1 |
2174 |
-4.19% |
| heavy faves |
-400 |
-200 |
1612 |
-2.97% |
| huge faves |
-9999 |
-400 |
1053 |
-5.59% |
| all dogs |
1 |
9999 |
4634 |
-5.47% |
| mild dogs |
1 |
200 |
2440 |
-5.60% |
| heavy dogs |
200 |
400 |
1430 |
-5.69% |
| huge dogs |
400 |
9999 |
764 |
-4.65% |
The number of dogs and favorites aren't equal because some games have money lines where both sides are negative, say -110, like a traditional bet with a spread of zero. There's also a big asymmetry when the odds are long. For instance the favorite might be -800 and the underdog is +561. That doesn't represent a huge vig, it's just a quirk of how American-style odds work (covered in the book).
Caveats and bootstraps
The table above isn't telling the whole story. I'm not conveying a sense of the volatility in the rate of return. Huge underdogs have a bigger payout when they do win, so the outcomes are going to be a lot more variable than betting the favorites.
-4.65% is the best estimate of the rate of return for huge underdogs, but maybe we just got lucky, or unlucky. A couple of longshot bets winning or losing could drastically change the overall return rate.
To test volatility, I used bootstrapping, previously covered in one in e. I repeatedly randomly sampled 80% (611/764) of the huge underdog bets and calculated the rate of return on that set. Looking at the range of outcomes helps illustrate the variability of these bets.
Doing that 100 times leads to a pretty wide spread of rates of return:
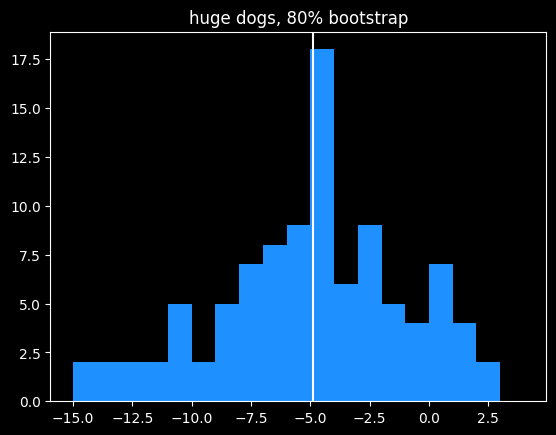
Although the mean value is close to the overall mean, 15% of bootstrapped samples actually had a positive rate of return. This is similar to what we saw in cool parlay, bro, where due to variance, even gamblers with no advantage over the house had a small chance of making money over a long period of time off of parlays. I described that situation "like a lottery where you have a 12% chance of winning $3,617, but an 88% chance of losing $10,221." This is a similar proposition.
Bridgejumper parlays and p-hacking
We'd need a lot more data to get a crisp estimate of the rate of return on huge underdogs, but we can have more confidence in the estimated -5.59% rate for huge favorites. Huge favorites being disadvantaged kind of contradicts the favorite-longshot bias theory, but it doesn't surprise me at all due to a strange phenomenon I've seen over and over again online.
It's a type of bet sharps might call "bridgejumper parlays" and squares on the internet unironically call "free money parlays" -- a parlay of a whole bunch of heavy favorite money lines together.
The gambler starts with some heavy favorite they like and keep adding more heavy favorites to the parlay till they get plus odds (they can win more than they risk), ending up with 5-6 heavy favorites on the same parlay. They will pick legs of the parlay from different sports, if necessary. There usually aren't enough heavy favorites in the NBA on a particular night to get to the magic > +100 payout.
An example you might see posted on reddit or twitter would be a 6 leg parlay with a payout of +105 like:
- Celtics -600
- Nuggets -900
- OKC -1000
- Lakers -600
- Duke -600
- Some UFC Guy, because they needed a sixth bet -700
I've talked to a couple people who take bridgejumper parlays, and they genuinely seem to think they've found some kind of glitch in the matrix -- all of the legs of the bet have a high chance of winning, therefore the bet is a sure thing.
A sensible person would know that sportsbooks aren't in the business of offering free money so maybe they're missing something. A humble person would assume they probably hadn't discovered some clever trick the sportsbooks don't know about. But most people who get into betting aren't sensible or humble (they think they can see the future, after all), so for a certain class of bettor, this type of wager just feels like a sure thing.
In parlay form, the fallacy seems obvious to me. Just because the individual risk on each leg of the parlay is small, that doesn't mean the combined risk is.
There's a more sophisticated version of this fallacy in statistics called p-hacking. As always, there's an xkcd about it. A particular experiment might have a 5% chance of giving a false result. 5% is a pretty small number. But if you do 13 of those experiments, there's about a 50% chance that at least one of them will give a false result. Even people who are good at math and science probably don't have a good sense of what $.95^{13}$ equals. It's sort of like a 13 leg parlay of money line bets at -1900.
Next time: more on point totals, money lines, and human nature.
Aug 08, 2025
Song: The Impressions, "Do You Wanna Win?"
(This is an excerpt from a larger project about sports gambling. Code used, and early drafts of some of the chapters can be found at https://github.com/csdurfee/book.)
I'm going to return to the subject of sports betting this week. Let's start with something easy. How do you avoid going broke betting on sports? That's easy. Reduce your bet size to zero. Scared money don't lose none.
As long as there is randomness, there will be outliers and unexpected results. It is impossible to escape randomness in sports betting. Any time you decide to bet, you enter the kingdom of randomness and have to abide by its laws. It doesn't matter whether you have an advantage over the house (unless the advantage is truly massive). Nothing is guaranteed.
This is a pretty hard thing for us to know how to deal with, when our brains are pattern-finding machines. Our brains will find patterns to give us a sense of control.
Notes
I talk about "win rate" a bunch below. That means the percent of the time a gambler can win bets at even odds (such as a standard spread bet on the NBA or NFL.)
The random walks shown below are a little different from a standard one, because I'm simulating the vig. The walker goes 1 block north when the coin comes up heads (or they win the bet), and 1.1 blocks south when the coin comes up tails (or they lose the bet.)
In the marches of madness
The NCAA holds the March Madness tournament every year to determine who the best college basketball team is. It's a single elimination tournament of 64 teams, arranged into a big bracket.
Say we do a March Madness style bracket with coin flippers instead of basketball teams. We randomly assign them places in the bracket. For each matchup, the coin flipper at the top of the matchup flips a coin. If they get heads, they survive and advance. If they get tails, they lose.
Somebody's going to go 6-0 and win that tournament.
Now imagine we expanded that to every single person on the planet. Every single person gets matched up into a 64 person bracket, then each of those winners get added to another 64 team bracket, and so on.
Eventually, someone has to emerge the victor with a 32-0 record or something -- the greatest coin flipper in the world. Right?
Random walks
Imagine going on a walk. Every time you get to an intersection, you flip a coin. If it's heads, you go one block north and one block east. If it's tails, you go one block south and one block east. This is called a random walk. It's a bit like a gambler's profits or losses plotted on a graph as a function of time.
I think there's a huge value in knowing what random walks look like. Do they remind you of anything?
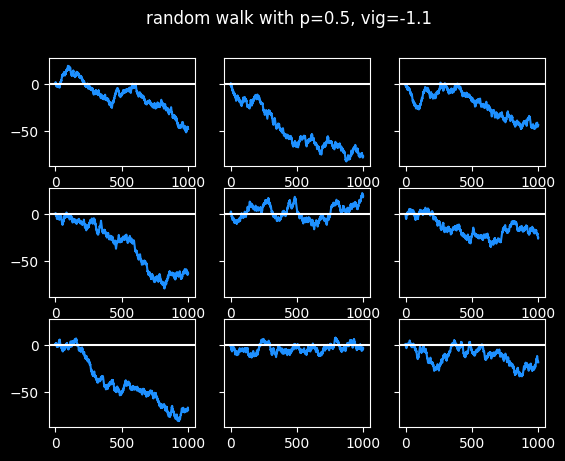
Touts are people who sell recommendations about which bets to take. Pay $30 and they'll tell you which side to bet on the big game tonight. (I have a whole section about touts in the book.) The best tout I could find has had pretty steady success for nearly 20 years, with a win rate of 54.1% against the standard vig. That's statistically significant, but it's not enough to guarantee success moving forwards. Even if they continue to place bets that should win 54.1% of the time -- they're flipping a slightly biased coin -- that doesn't mean they'll make money on those bets. Let's look at some random walks at 54.1% win rate:
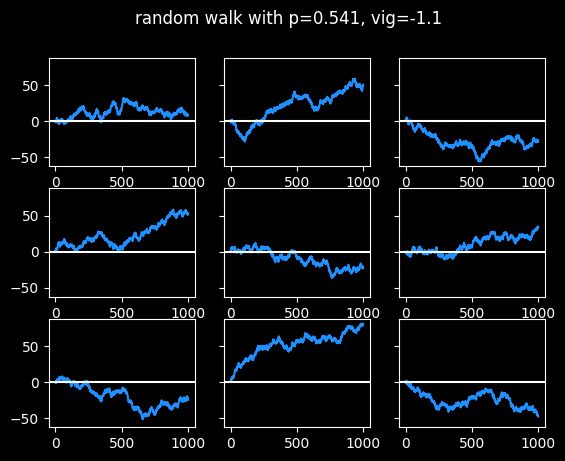
Three of the random walks ended up around 50 units after 1000 bets, which is pretty good. Two of them made a tiny bit of money. The other four lost money. This is a small sample size, but a 44% chance of losing money after paying for 1,000 picks at $30 a pop isn't great. (More info on the economics of touts in the book.)
The touts I looked at generally don't sell picks for every single game. So with 1200 games in an NBA season, this could be several years' worth of results.
Imagine all of these as 9 different touts, with the exact same level of skill at picking games. But some of them look like geniuses, and some look like bozos. There would probably be some selection bias. The ones with the bad records would drop out -- who's buying their picks if they're losing money? And the ones who did better than their true skill level of 54.1% would be more likely to stick with it. Yet all these random walks were generated with the same 54.1% win rate.
If you bought 1,000 picks from this tout, you don't get to choose which of the $2^{1000} = (2^{10})^{100} \approx 10^{300}$ possible random walks you will actually get. If each bet has a 54.1% chance of winning, there's no guarantee you will have exactly 541 wins and 459 losses at the end of 1000 bets.
Here's what someone who is right 60% of the time looks like.
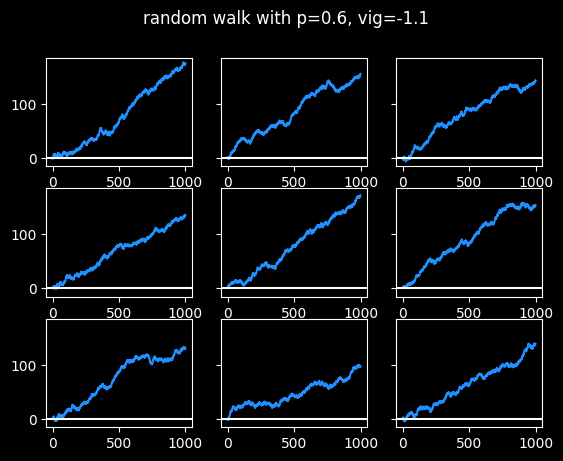
Success is pretty boring.
I've always said it's much harder to learn from success than from failure. At a 60% win rate, none of them really have long cold streaks, just small breaks between hot streaks. It wouldn't be interesting to tell stories about those graphs. There's nothing to learn, really.
I don't think it's possible to win 60% against the spread, based on what are called push charts, discussed in the book.
The graphs at the 54.1% success rate appear a lot more human. They have hot and cold streaks, swoons, periods where they seem stuck in a range of values. Some of them scuffled the whole time, a couple finally got locked in near the end, a couple were consistently good. Some had good years, some had bad years. Even though they are randomly generated, they look like they have more to teach us, like they offer more opportunities to tell stories. But they all have the exact same win rate, or level of skill at handicapping.
No outcome is guaranteed, but the higher the win rate, the more consistently the graph is going to go up and to the right at a steady pace.
Finally, here are some walks at 52.4% win rate, the break-even point. Most results end up close to zero after 1000 bets, but there is always a possibility of an extended run towards the positive or negative side -- it happened 4/9 times in this sample:
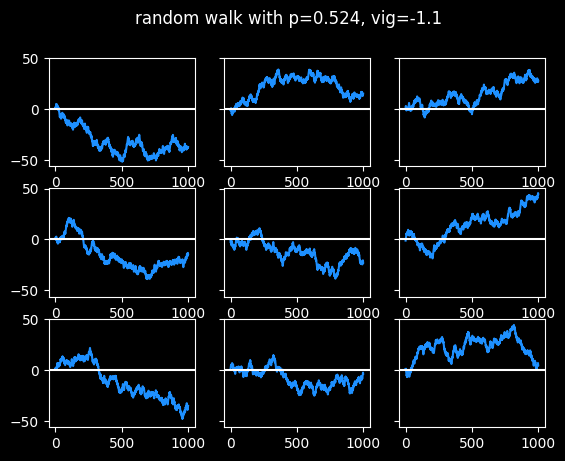
The Axe Forgets, The Tree Remembers
If those 9 graphs were stock prices, which one would you consider the best investment?
Well, we know they're equally bad investments. They're winning just enough to break even, but not make profits.
They all have the same Expected Value moving forwards. Previous results are meaningless and have no bearing on whether the next step will be up or down. Every step is the start of an entirely new random walk. The coin doesn't remember what has happened in the past. We do.
This is what's known in math as a Martingale, named after a betting system that was popular in France hundreds of years ago. (I previously talked about Martingales in the series on the hot hand.)
The basic idea behind all these betting systems is to chase losses by betting more when you're losing. Hopefully it's obvious that these chase systems are crazy, though formally proving it led to a lot of interesting math.
Fallacy and ruin
Even though chase systems are irrational, they've persisted through the centuries. Human beings are wired to be semi-rational -- we use previous data to try and predict the future, but we use it even when the data was randomly generated, and even when we don't have a significant amount of data. We need coherent stories to tell about why things happened. There is no rational reason to believe in a chase system, but I think there are semi-rational reasons to fall prey to the gambler's fallacy.
I hope these random walks show that having a modest, plausible advantage over the house isn't a guarantee of success, even over a really long timespan. Positive Expected Value is necessary, but not sufficient, for making money long term.
The vast majority of gamblers bet with negative expected value due to the vig, and possibly biases in the lines against public teams, as we saw in a previous installment. If each bet the average gambler makes has a negative expected value, they can't fix that by betting MORE.
"If I keep doubling down, eventually I'll win it all back." Maybe if you have infinite capital and unlimited time. Otherwise the Gambler's Ruin is certain. The market can stay liquid longer than you can stay irrational.
Maximizing profits: the Kelly criterion
Let's say a bettor really does have an edge over the house -- they can beat the spreads on NBA basketball 56% of the time.
Even with that advantage, it's easy to go broke betting too much at once. Suppose they bet 25% of their bankroll on each bet. What happens after 200 bets? 200 bets is not a lot, roughly 1 month of NBA games if they bet on every game.
Once in a blue moon they end up a big winner, but 53% of the time the gambler is left with less than 5% of their bankroll after 200 bets even though they have a pretty healthy advantage over the house. So it's still a game of chance rather than skill, even though it would require a lot of mental labor to make the picks, and time to actually bet the picks. The mean rate of return is quite impressive (turning $100 into $4,650), but the median result is bankruptcy (turning $100 into $3).
Intuitively, there has to be some connection between the betting advantage and the optimal amount to risk on each bet. If a gambler only has a tiny advantage, they should only be making tiny bets as a percentage of their total bankroll. The better they are, the more they can risk. And if they have no advantage, they shouldn't bet real money at all.
That intuition is correct. The Kelly criterion gives a formula for the exact percent of the bankroll to risk on each bet in order to maximize Expected Value, given a certain level of advantage. https://en.wikipedia.org/wiki/Kelly_criterion
In this case, the Kelly criterion says to bet 7.6% of the total bankroll on each bet. I did 100,000 simulations of a sequence of 200 bets following the Kelly criterion. The gambler only went broke around one time in 1,000, which is much better. The median result was turning $100 into $168, which is pretty good. However, the gambler still lost money 31% of the time.
This is just one month of betting, assuming the gambler bets on every NBA game. Losing money 31% of the time seems pretty high for what's supposed to be the optimal way to bet.
How about a longer period of time? I simulated 1,000 bets this time, nearly a whole season of the NBA. The median outcome is turning $100 into $1356, which is a sweet rate of return. But the chances of going broke actually increased! The player will go broke 1.4% of the time, about 11x more often on 1000 bets than 200, which seems unfair, but the Kelly criterion doesn't make any guarantees about not going broke. It just offers the way to optimize Expected Value if the gambler knows the exact advantage they have over the house.
Partial Kelly Betting
Kelly Betting is the optimal way to maximize profits, but what about lower stakes? The real power of Kelly betting is its compounding nature -- as the bankroll gets bigger or smaller, the bet size scales up or down as well. It also corresponds to our incorrect intuitive understanding of randomness -- it makes sense someone should bet smaller amounts when they're on a cold streak, and larger amounts when they're on a hot streak.
What if the gambler only bets 2% of their bankroll instead of the 7.6% recommended by the Kelly criterion? They don't go broke a single time in 100,000 simulations of 1,000 bets. The mean rate of return is 4.6x and the median is 3.7x. That's a pretty nice return on investment, relative to the risk. The gambler still lost money 2.8% of the time, though. Being conservative, betting a lot of games at positive expected value, and betting the right way greatly increase the chances of success, but nothing can eliminate the possibility of failure.
Imagine doing 1000 bets at 56% win percentage and a conservative bet size, and still losing money. Wild, isn't it? If you take one thing away from this article, it should be:
Failure is always an option.
Betting a constant amount
You wouldn't have that problem with betting a constant amount, right? Say a gambler has a bankroll of $100 and bets to win $20 on each game. 1000 games, 56 win %.
This Expected Value of playing this way doesn't have any randomness in it. It's just a simple algebra problem. According to EV, they should end up with $252 at the end of the season, for a profit of $152. Nice. But as I've mentioned before, EV says nothing about the range of possible outcomes.
If I actually simulate it, a pretty wide range of outcomes are possible. 99% of the time, the gambler makes money, but 6 times out of 100,000, they lose everything and more. (6 in 100,000 is about the same odds as winning a 14 leg parlay.)
With betting a fixed size, the rate of return is lower and the risk of going broke doesn't go away. So it's sub-optimal compared to Kelly-style betting with a very small percentage of the total bankroll.
Jul 24, 2025
(This is an excerpt from a larger project about sports gambling. Code and early drafts of some of the materials can be found at https://github.com/csdurfee/book.)

I'll be talking about "the public" in this installment, by which I mean the side of a wager that gets the most number of bets placed on it.
I talk about the vig a lot without explaining it. It's explained in the book, but the short version is on standard bets, a gambler needs to win at least 52.4% of the time against the spread to break even due to needing to risk $110 to win $100. That $10 difference is the vig -- how the sportsbook makes their money.
In gambling circles, bets are often framed as Vegas or the sharps versus the public. Sharp started out as a term for cheaters -- dishonest bookies setting unfair lines, or card sharps who win thru deception rather than skill. The meaning has changed a bit over time. In modern parlance, a sharp is someone who wagers on sports as a game of skill, making money over the long term by placing bets with positive expected value. But the negative connotation persists in popular chatter about gambling. There's something unseemly about using math to decide which bets to take.
Say there's a game between the Lakers and the Charlotte Hornets, and the Hornets win against the spread. The public lost. What degenerate is betting the Hornets? Sharps, that's who. You'd think the public wouldn't have a problem with the sharps -- at least someone won money off Vegas tonight. Without the sharps, all the money that the public lost would go to Vegas. But Vegas and sharps are often conflated together. It's the public versus everybody.
It seems unlikely to me that it's always the public on one side of the bet and sharps on the other. The public is still right around 50% of the time, right? They can't be drastically worse than a coin flip, so taking the opposite bets can't be drastically better than a coin flip. That means that sharps are going to agree with the public at least some of the time. They might fade the public (bet the opposite side) more often than they agree with the public, but there's probably a fair amount of both.
How do bettors do against the spread as the season goes on?
Does the public side do better over time? If records against the spread were random and the lines totally fair, we'd expect the public's winning percentage to bounce around pretty close to 50%, spending about as much time on both sides of the line -- sometimes doing a little better than 50%, sometimes a little worse. Over the course of the season, the public's cumulative record against the spread should get closer and closer to 50%, as the sample variance gets smaller.
Here's the 2024-2025 data. This is the public's winning percentage, graphed as a 100 game moving average:
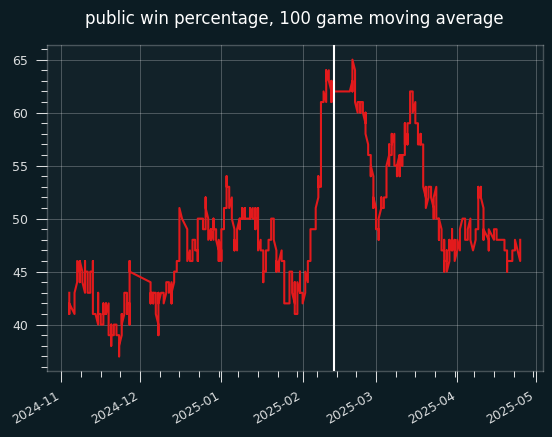
The white line is the start of the All-Star break. The public was winning well below 50% of their bets until a surge in the 100 or so games before the break, as we can see on the cumulative graph:
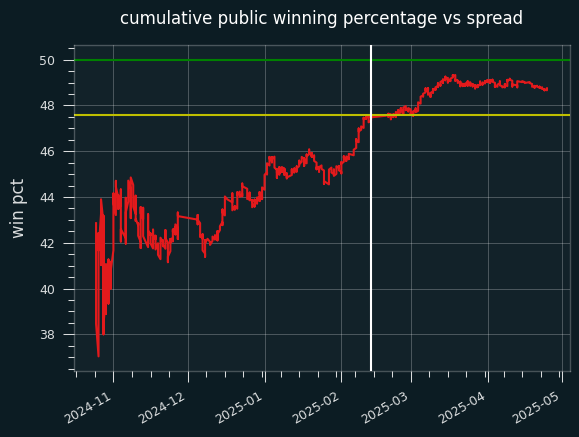
The public ended up going 584-614 on the season. Someone taking the public side of every bet against the closing line would have lost 91.4 units on the season, for a 48.75% winning percentage.
The yellow line is the break-even point for fading the public -- taking the non-public side on every bet over the season. Up until that surge before the All Star break, it would've been extremely profitable to do so. Even by the end of the year, the public's win percentage didn't get close to 50%. Someone betting at -105 reduced juice could have made .8 units by fading the public on every single bet.
The public were 369-388 when betting on the favorite, and 215-226 betting on the underdog. They went 293-311 when the away team won, and 291-303 when the home team won. They were bad no matter how you slice it.
While that's all super weird, it's only one season. My data source (sportsbookreview.com) only has spotty data for the 2023-24 NBA season, but they do have mostly complete data for 2021-22 and 2022-23. (Nothing before that, unfortunately.)
2021-22 season
I have data for 1108 out of 1230 regular season games for 2021-22.
The public went 566-542 on the season, for a loss of 30.2 units, much better than 2024-25.
Here's the 100 game moving average:
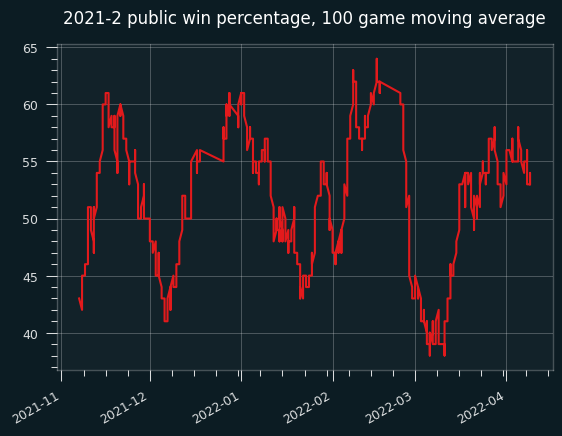
Except for a dip in early March, the public did consistently fairly well. Not well enough to make money, but better than 50% win percentage.
On the cumulative graph, while fading the public (yellow line) would have been profitable for the first month or so, the graph spends most of the season over the 50% line. However, it never gets over 52.4%.
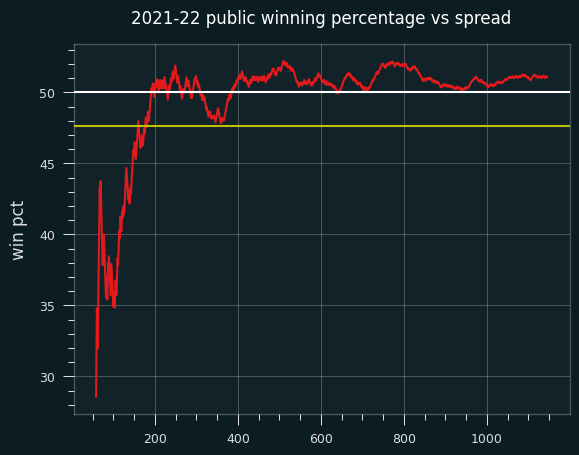
2022-23 season
I have data for 1176 off 1230 games in 2022-23.
The public went 587-589 for the season, for a loss of 61 units on the season. That's remarkably fair, if the vig weren't a factor. Here's the moving average:
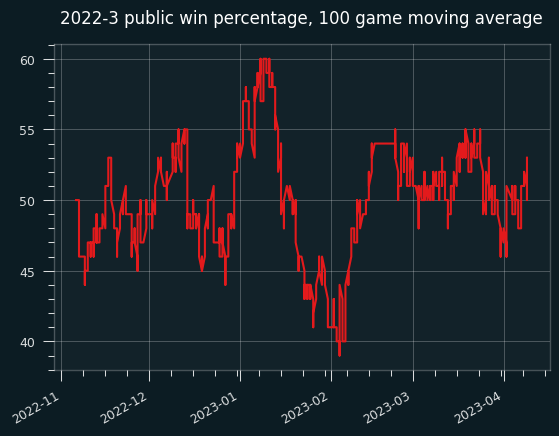
And the cumulative:
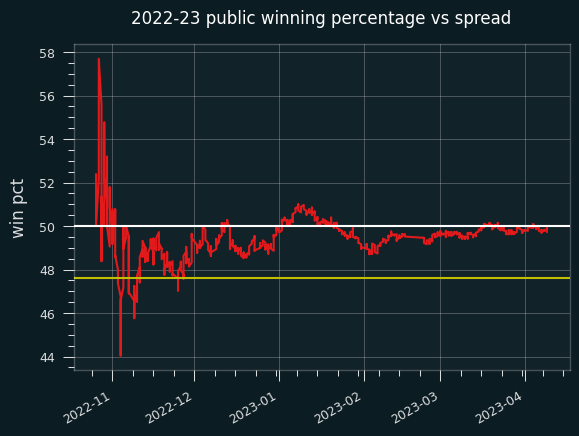
This one is similar to the 2023-24 graph, where the public pretty consistently lost a little bit more the 50% of the time, but not often enough to make fading the public a viable strategy.
Are team records against the spread random?
I started to answer this last time, but didn't have time to go deeper. If betting records are random, previous performance gives no information about future performance. Each game is like a coin flip, with equal chances of heads and tails. Teams will have good or bad records against the spread due to chance alone.
However, I gave some plausible reasons why this might not be the case.
The simplest way to test this I could think of was comparing records against the spread in the 1st half of the season to the 2nd half of the season. If the records are random, there should be no correlation between 1st half and 2nd half records.
I found there was a positive correlation between 1st half and 2nd half records in all three seasons I have data for. In 2023-24, the correlation coefficient was .10. In 2022-23, it was .40, and in 2021-22 it was .27. Only 2022-23 was statistically significant. Assuming randomness, positive and negative correlation should be equally likely. So all three being positive is suspicious. I don't think records against ths spread are totally random.
Say we track which teams had winning records against the spread over the 1st half of the season, then bet on those teams for the 2nd half of the season. (I didn't bother to filter out the games where teams with winning records play each other, so this analysis isn't perfect.)
In 2024-25, that would give a record of 297-297 ATS -- can't get more fair than that.
In 2022-23, it would have gone 279-241, for a profit of 13.9 units at standard vig, and a 53.7% winning percentage.
In 2021-22, it would have gone 247-225, for a loss of .5 units and a 52.3% winning percentage.
So, it's definitely not enough to be profitable as a strategy on its own. But it's close, and that's interesting.
A gambler needs to win at least 52.4% of the time to break even against the vig. Say they're picking from a subset of bets that have a 52.3% chance of winning, as the naive strategy achieved in 2021-22. They'd just barely need to do better than flipping a coin to be profitable. That could be much easier than picking from a set of bets with a 50% chance of winning, right?
Final thoughts
In all three seasons, the public did a little worse in the first half of the season than the second half. In the two most recent seasons, the cumulative winning percentage was below 50% for nearly the whole season.
That doesn't seem random to me. It makes sense that sportsbooks would offer slightly more favorable odds to the less popular team in order to attract equal money on both sides. It also makes sense that sportsbooks would be happy if the team with more money on it lost over 50% of the time. The difference between the public winning 50% of the time and the public winning 48.5% of the time could be significant on enough betting volume.
In all three seasons, there was a positive correlation between a team's record against the spread over the first half of the season and the second half. The correlation is strong enough that over 3 seasons, it's almost possible to make money by betting on teams with a good first half record.
On both points, I don't have nearly enough data to draw grand conclusions about how "the market" operates -- this is just one sportsbook, and an unknown one at that. Yahoo and DraftKings also provide betting percentage data, which would be useful for cross-checking these trends. I'm going to hold off for now, though -- there are too many other interesting things in the world.
Jul 18, 2025
code available at https://github.com/csdurfee/book.

Two types of people
Lots of sportsbooks publish info on how much action they've gotten on each side.
Here's DraftKings': https://dknetwork.draftkings.com/draftkings-sportsbook-betting-splits/
It's a smart move. It's good for SEO (to the extent that still matters). And I'm sure they get a lot of people who decide to take bets from that page.
For example, the Pacers were playing Brooklyn the night I wrote this. 27% of the bets were on Brooklyn at +10.5. 73% are on Pacers -10.5.
Somebody who sees that and decides to make a bet based on that information could bet either way. They could either tell themselves, "Everybody's taking the Pacers, so it must be a good bet" or "Everybody's taking the Pacers, so it must be a bad bet".
What are those two groups like when they're not betting on basketball, do you think? Do they use the same kind of toothpaste? Watch the same kind of TV shows? Vote the same way?
The public gets what the public wants
One bit of gambling lore is that there are "public" teams that get bet on more frequently, regardless of the line. Like, your cousin who's a Cowboys fan is going to bet the Cowboys on Thanksgiving regardless of whether it's a fair line or not. He'd watch the game and root for the Cowboys anyway, but it's a little more fun that way. The Cowboys aren't just a random number generator to him.
There's a social aspect to gambling now that I imagine didn't exist when it was underground. Lots of gamblers will follow bets that other people have placed. If the bet wins, I'm sure it's a cool communal thing to be a part of. But social media often doesn't obey the wisdom of crowds -- in places like reddit where users vote content up and down, the conventional wisdom is going to be amplified, and people with minority opinions are going to be suppressed. If well over 90% of sports gamblers lose money long term, the majority opinions are going to be bad.
I scraped betting percentage data from sportsbookreview (SBR) for the 2024-5 season. They don't say where they get the betting percentages from. If I had to guess, it would be MGM Grand, their primary source of other data. The SBR numbers seemed to indicate more action overall than a couple other sources I found -- the betting percentages were closer together. Other sites had games where there's 10% action on one side and 90% on the other, which seems implausible on a large volume of bets. So it's probably a pretty big site, whatever it is.
As with the data from the previous installment, there are 32 games out of 1230 missing data.
The money_percents column is the median amount bet on each team. The money_game_winners column tracks the number of games where that team got the majority of the money bet on their side. Both of these can be taken as indicators of how much teams are favored by the public.
Here are the teams sorted by money_percents. The teams near the top were less popular with gamblers, the teams at the bottom more popular.
|
winner |
loser |
ats_win_pct |
money_percents |
money_game_winners |
| New Orleans |
34 |
44 |
44 |
39.5 |
20 |
| Charlotte |
36 |
42 |
46 |
41.5 |
24 |
| Miami |
39 |
41 |
49 |
43 |
20 |
| Philadelphia |
26 |
52 |
33 |
43.5 |
29 |
| Portland |
45 |
33 |
58 |
43.5 |
25 |
| Orlando |
41 |
40 |
51 |
44 |
29 |
| Utah |
39 |
38 |
51 |
45 |
33 |
| Sacramento |
35 |
44 |
44 |
45 |
32 |
| L.A. Clippers |
47 |
34 |
58 |
46 |
27 |
| San Antonio |
38 |
41 |
48 |
47 |
31 |
| Chicago |
42 |
38 |
52 |
47 |
36 |
| New York |
38 |
44 |
46 |
48 |
38 |
| Phoenix |
29 |
49 |
37 |
48 |
36 |
| Washington |
33 |
46 |
42 |
49 |
37 |
| L.A. Lakers |
48 |
33 |
59 |
51 |
42 |
| Indiana |
38 |
43 |
47 |
51 |
42 |
| Atlanta |
37 |
42 |
47 |
52 |
41 |
| Boston |
39 |
42 |
48 |
52 |
43 |
| Minnesota |
37 |
43 |
46 |
52 |
43 |
| Dallas |
37 |
44 |
46 |
52 |
41 |
| Detroit |
41 |
38 |
52 |
53 |
43 |
| Brooklyn |
42 |
35 |
55 |
53 |
41 |
| Toronto |
49 |
28 |
64 |
53 |
47 |
| Golden State |
42 |
40 |
51 |
54 |
51 |
| Houston |
44 |
38 |
54 |
54 |
49 |
| Oklahoma City |
53 |
29 |
65 |
54.5 |
54 |
| Milwaukee |
44 |
38 |
54 |
56.5 |
56 |
| Cleveland |
47 |
33 |
59 |
57 |
53 |
| Memphis |
41 |
41 |
50 |
57 |
51 |
| Denver |
37 |
45 |
45 |
58.5 |
63 |
The public favorites
The most popular teams with NBA gamblers were Denver, Cleveland, Memphis, Milwaukee, and Oklahoma City. Denver got the most money in 63 of 82 games they played, which is remarkable.
Cleveland, OKC and Memphis were dominant for most of the season.
Denver and Milwaukee have two of the best and most entertaining players in the league. Both Giannis for Milwaukee and Jokic for Denver are fun to root for. People like to take bets on teams that are fun to follow.
The ugly dogs
The bottom teams were New Orleans, Charlotte, Miami, Philadelphia and Portland. All these teams except for Portland were total bummers to watch and cheer for this year. They had injuries and organizational dysfunction that led to totally wasted seasons. People don't like to take bets on teams that are a bummer to follow.
This hints at the fact that a lot of people are taking bets because they want that team to win the bet, rather than because they believe the bet has a positive expected value. It's entertainment, not a business investment.
Against the spread
Here's the same data sorted by record against the spread.
|
winner |
loser |
ats_win_pct |
money_percents |
| Philadelphia |
26 |
52 |
33 |
43.5 |
| Phoenix |
29 |
49 |
37 |
48 |
| Washington |
33 |
46 |
42 |
49 |
| New Orleans |
34 |
44 |
44 |
39.5 |
| Sacramento |
35 |
44 |
44 |
45 |
| Denver |
37 |
45 |
45 |
58.5 |
| Dallas |
37 |
44 |
46 |
52 |
| Charlotte |
36 |
42 |
46 |
41.5 |
| Minnesota |
37 |
43 |
46 |
52 |
| New York |
38 |
44 |
46 |
48 |
| Indiana |
38 |
43 |
47 |
51 |
| Atlanta |
37 |
42 |
47 |
52 |
| San Antonio |
38 |
41 |
48 |
47 |
| Boston |
39 |
42 |
48 |
52 |
| Miami |
39 |
41 |
49 |
43 |
| Memphis |
41 |
41 |
50 |
57 |
| Orlando |
41 |
40 |
51 |
44 |
| Utah |
39 |
38 |
51 |
45 |
| Golden State |
42 |
40 |
51 |
54 |
| Detroit |
41 |
38 |
52 |
53 |
| Chicago |
42 |
38 |
52 |
47 |
| Houston |
44 |
38 |
54 |
54 |
| Milwaukee |
44 |
38 |
54 |
56.5 |
| Brooklyn |
42 |
35 |
55 |
53 |
| L.A. Clippers |
47 |
34 |
58 |
46 |
| Portland |
45 |
33 |
58 |
43.5 |
| L.A. Lakers |
48 |
33 |
59 |
51 |
| Cleveland |
47 |
33 |
59 |
57 |
| Toronto |
49 |
28 |
64 |
53 |
| Oklahoma City |
53 |
29 |
65 |
54.5 |
Philadelphia, Washington and Phoenix were just as terrible at the sportsbook as they were on the basketball court. OKC and Cleveland had outstanding seasons in both places.
However, there's only a rough correlation between how good the teams were at actual basketball, and at beating the spread. Minnesota, New York and Denver were in the bottom 10 by winning % against the spread, even though they had good records and were doing their best to win. Denver lost to the eventual champs, and New York and Minnesota made the conference finals. Indiana was the 10th worst team against the spread, and made the NBA Finals. Toronto and Brooklyn weren't really trying to win a lot of basketball games, but ended up in the top 10. There is no good reason I can think of for the Lakers to be in the top 4 against the spread -- aren't they the epitome of a public team that should be getting unfavorable lines?
Which teams should the public love and hate?
I calculated the amount of units a gambler would win or lose if they bet on each team when they got the majority of the bets. This is a sort of measure how happy the proverbial public should be about each team.
public_units is the amount won/lost betting in favor of the team. Phoenix, Sacramento, Dallas, Denver and Indiana disappointed the public the most.
|
public_units |
| Phoenix |
-16.5 |
| Sacramento |
-14.2 |
| Dallas |
-13.6 |
| Denver |
-12.6 |
| Indiana |
-12.6 |
| Atlanta |
-11.5 |
| Utah |
-11.1 |
| Chicago |
-10.2 |
| Minnesota |
-9.5 |
| Detroit |
-7.4 |
| Philadelphia |
-6.7 |
| New York |
-6.1 |
| Brooklyn |
-5.2 |
| Washington |
-5 |
| Boston |
-3.2 |
| New Orleans |
-3.1 |
| Memphis |
-1.5 |
| Charlotte |
-1.2 |
| Miami |
-1 |
| San Antonio |
-0.5 |
| Orlando |
-0.4 |
| Milwaukee |
1.4 |
| Golden State |
2.7 |
| L.A. Lakers |
4.2 |
| Houston |
4.9 |
| Cleveland |
6.8 |
| Portland |
10.3 |
| Toronto |
11.3 |
| L.A. Clippers |
12.3 |
| Oklahoma City |
18.3 |
This is a pretty random list of teams, in both directions. It's a good illustration that gamblingball is different from basketball. It's not clear whether gamblingball is a game with an element of skill, or if it's all chance.
Are records against the spread due to chance?
If we assume that all variations are due to randomess, each game should be a coin flip whether the underdog or favorite wins against the spread.
Calculating exact odds using the binomial distribution, 94% of NBA teams should have between 33 and 49 wins against the spread over an 82 game season.
We'd expect 2 teams to be outside that range, and there are 3. Philadelphia went 26-52 in 78 games we have data for. Even if they won the other 4 games that are missing data, they'd only have 30 wins. So that record was definitely an outlier, but overall the season was about what we'd expect based on chance.
I find it very believable that some teams are more likely to have a winning record against the spread, because they are underestimated by the handicappers or the betting public. They end up getting lines that are too generous, and thus do better than expected against the spread over the long run. Toronto could be an example of that. They were bad, but they weren't really as bad as people thought.
Other teams could be inherently worse against the spread, as well. Perhaps they are super popular to bet on, so the lines tend to move against them -- a public team. Or perhaps gamblers and sportsbooks overvalue the team -- the conventional wisdom is that they'll be good when they're not. That definitely describes Philadelphia and Phoenix.
In both cases, the teams themselves aren't necessarily doing anything to be better or worse against the spread than an average team would be. It's about the perceptions of the bookmakers and gamblers. Teams can't help what bookmakers set the lines to be.
Do gamblers follow the record against the spread?
If a team's record against the spread is due solely to random error, then we've got a LeMartingale on our hands. The current record would have no bearing on the future record. So gamblers shouldn't factor it in when deciding to take a bet or not.
By the end of the season, there was a significant correlation between money percents and win percentage against the spread. I wanted to see how that might've changed over time. So I generated the table shown above for every single day of the season, and calculated the correlation on that day. Here's what that looks like over time:
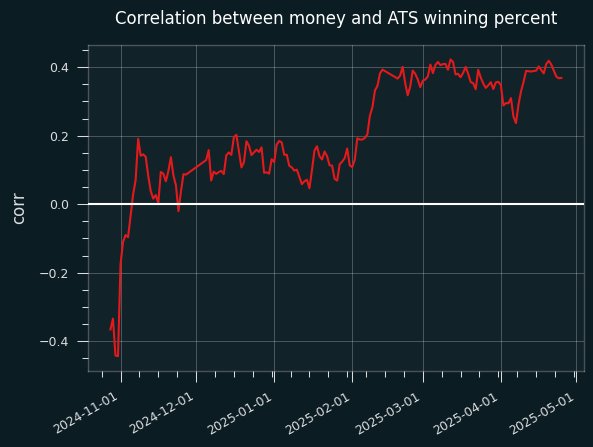
The money percentages are cumulative, the mean of all games in the season that have come before -- it's not showing gamblers' betting behavior on a particular day. The graph is a lot smoother that way, but we're losing something.
It also doesn't show whether records against the spread are a Martingale or not. The correlation between betting percentages and win records increases over time, but that doesn't mean this is because gamblers are behaving rationally.
The jump in correlation around mid-Februrary corresponds to the All-Star break, which is curious.
Stay tuned; I'll have more on this.