NBA push charts

Song: Geraldo Pino, "Heavy Heavy Heavy"
Code: https://github.com/csdurfee/scrape_yahoo_odds/. See the push_charts.ipynb notebook.
NBA Push Charts
In the past couple of posts, I've looked at NBA betting data from BetMGM. There are multiple types of bets available on every game. A push chart maps the fair price of a spread bet to the equivalent money line bet. How often does a team that is favored by 3 points win the game outright? It's going to be less often than a team favored by 10 points. The money line should reflect those odds of winning.
You can find a lot of push charts online, but they tend to be based on older NBA data. With more variance due to a lot of 3 point shots, and more posessions per game, I wouldn't expect them to still be accurate.
Push charts are useful for assessing which of two different wagers is the better value. Here's an example of a game where different sportsbooks have different lines for the same game:
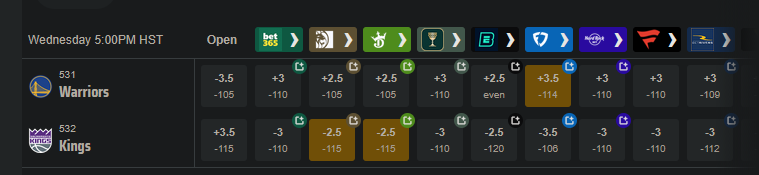
Say you want to bet on the Warriors. They have some players out tonight (Nov 5, 2025) so they're the underdogs, but they are also playing the dysfunctional Kangz, so it might be a good value bet. You could take the Warriors at either +3.5 -114, +3 -110, or +2.5 -105. Which bet has the highest expected value? If the Warriors lose by 3, the +3.5 bet would win, but the +3 bet would push (the bet is refunded), and the +2.5 bet would lose. A push chart can give a sense of how valuable the half points from +2.5 to +3, and +3 to +3.5, are. Is the probability of the Warriors losing by exactly 3 -- the value of getting a push -- worth going from -105 to -110?
[edit: the Warriors, without their 3 best players, led for most of the game before eventually losing by 5 after Russell Westbrook had one of his best games in years. So the line was only off by 2 points. The lines are often uncannily close, even when a bunch of weird stuff happens. Sometimes it all kinda cancels out.]
I'm going to do a push chart two different ways, then combine them. For almost every game over the last 4 years, we have the money line and the spread, so we can match them up directly. These will have the vig baked in. And as we saw previously, the money line for favorites has a slightly better expected value than the average bet on the spread. So it's going to end up a little biased.
We can also calculate a push chart without any vig by looking at winning percentage for every spread -- what percent of the time does a +3.5 point underdog actually win the game. It will need some smoothing, since the data will be noisy.
The retail NBA push chart
I matched up the spread and the money line for both the home and the away team on each game, then took the median of those values. Spreads in the range of -0.5 to +0.5 are very rare, as are spreads over -13.5/+13.5, so I've omitted those.
|spread |money line|
|------:|---------:|
| -13.5 |  -1000   |
| -12.5 |   -750   |
| -11.5 |   -650   |
| -10.5 |   -550   |
|  -9.5 |   -450   |
|  -8.5 |   -375   |
|  -7.5 |   -300   |
|  -6.5 |   -250   |
|  -5.5 |   -225   |
|  -4.5 |   -190   |
|  -3.5 |   -160   |
|  -2.5 |   -140   |
|  -1.5 |   -120   |
|   1.5 |    100   |
|   2.5 |    115   |
|   3.5 |    135   |
|   4.5 |    155   |
|   5.5 |    180   |
|   6.5 |    200   |
|   7.5 |    240   |
|   8.5 |    290   |
|   9.5 |    340   |
|  10.5 |    400   |
|  11.5 |    475   |
|  12.5 |    525   |
|  13.5 |    625   |
This gives us how BetMGM prices the value of individual points on the spread (with the vig figured in). This is sort of their official price list.
American style odds are symmetrical if there is no vig involved. A -400 bet implies a 4/5 chance of winning, and a +400 bet implies a 1/5 chance of winning. If the -400 bet wins 4/5 of the time and loses 1/5 of the time, the gambler breaks even, and vice versa. So a no-vig money line would be +400/-400.
The odds offered by the sportsbooks are asymmetrical, because they want to make money. We see that +13.5 on the spread maps to a +625 money line, but -13.5 maps to -1000. A +625 bet should win 100/(100+625), or about 14% of the time. A -1000 bet should win 1000/1100, or 91% of the time. Adding those together, we get 91% + 14% = 105%. That extra 5% is called the overround, and is the bookmaker's guaranteed profit, assuming they have equal wagers on both sides.
Here's what that data looks like as a graph, with some smoothing added.
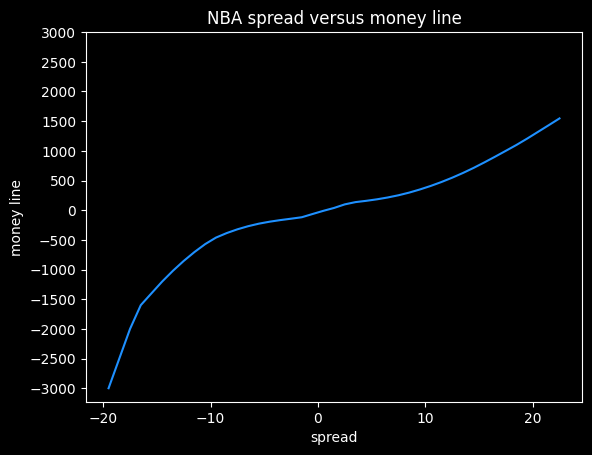
I think this shows the bias against heavy favorites that we saw previously. Note how the line gets much steeper moving from -10 to -20 on the spread, versus moving from +10 to +20.
At -20.5, this graph gives a payout of -5000, but at +20.5, it gives a payout of +1320. The fair payout is somewhere in between those two numbers.
If the fair payout is (-5000/+5000), then the underdog is getting way less of a payout (in essence, paying more in vig) than they should. If the fair payout is closer to (-1360/+1360), then the favorite is paying more in vig than they should. So the asymmetricality gives a clue that sportsbooks aren't splitting the vig down the middle, but it doesn't tell us the fair price.
Push charts based on win frequencies
We can estimate a fair price by going through all the games and see how often a +3.5 underdog wins outright, then convert that percentage to a fair money line. The problem here is that the results will be very noisy. We'd need hundreds or thousands of games at each spread value, and we only have 4,500 or so games overall. So it's gonna be chunky. We'll have to do some smoothing on it, (foreshadowing alert: it will lead to weird results later on)
Here are the win ratios by spread, combining both home and away teams:
| spread| win ratio |
|------:|----------:|
| -13.5 | 0.889764  |
| -12.5 | 0.835616  |
| -11.5 | 0.832487  |
| -10.5 | 0.789474  |
|  -9.5 | 0.747212  |
|  -8.5 | 0.762763  |
|  -7.5 | 0.745763  |
|  -6.5 | 0.701299  |
|  -5.5 | 0.643892  |
|  -4.5 | 0.6       |
|  -3.5 | 0.641682  |
|  -2.5 | 0.562393  |
|  -1.5 | 0.525535  |
|   1.5 | 0.474465  |
|   2.5 | 0.437607  |
|   3.5 | 0.358318  |
|   4.5 | 0.4       |
|   5.5 | 0.356108  |
|   6.5 | 0.298701  |
|   7.5 | 0.254237  |
|   8.5 | 0.237237  |
|   9.5 | 0.252788  |
|  10.5 | 0.210526  |
|  11.5 | 0.167513  |
|  12.5 | 0.164384  |
|  13.5 | 0.110236  |
A team with a -1.5 point spread wins 52.6% of the time, which is very close to the break-even point on standard -110 bets of 52.4%. So a gambler needs to be at least 1.5 points better than Vegas at setting the lines to expect to make money.
These odds have to be symmetrical. If a team favored by -4.5 wins 60% of the time, then a +4.5 point underdog has to win 40% of the time.
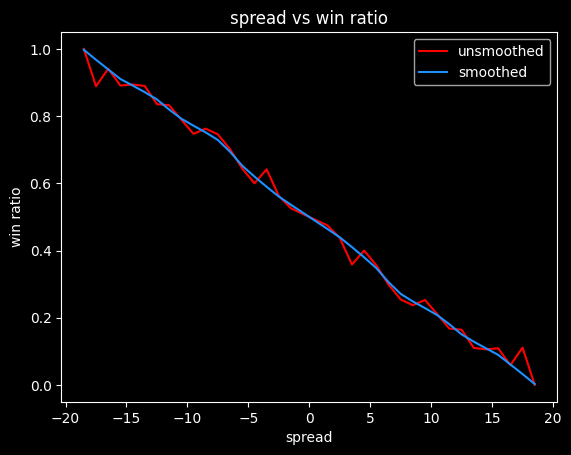
Unfortunately, this data is probably too chunky to give good results. -4.5 has a lower win rate than -5.5, which doesn't make any sense. The more negative the spread, the higher the win rate should be. Here's what it looks like with smoothing:
We can convert these winning percentages to fair (no vig) money lines:
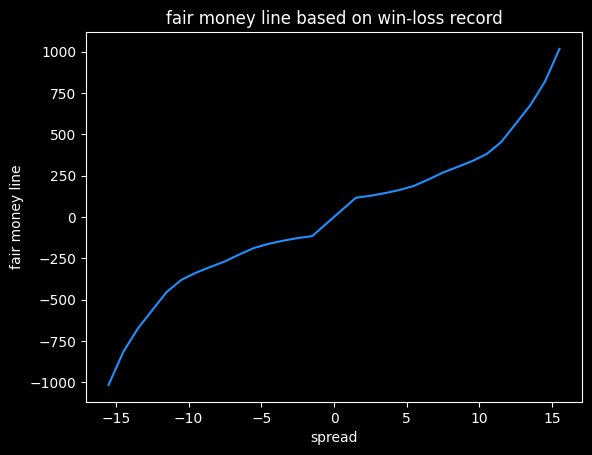
Converting to money lines doesn't break the symmetry. A -4.5 favorite gets a money line of -163, and a 4.5 point underdog gets a money line of +163.
This is just a first attempt. Different ways of smoothing the actual win rates will lead to different results.
|spread |fair ML |
|------:|-------:|
| -13.5 |   -677 |
| -12.5 |   -565 |
| -11.5 |   -454 |
| -10.5 |   -381 |
|  -9.5 |   -338 |
|  -8.5 |   -303 |
|  -7.5 |   -269 |
|  -6.5 |   -227 |
|  -5.5 |   -188 |
|  -4.5 |   -163 |
|  -3.5 |   -144 |
|  -2.5 |   -128 |
|  -1.5 |   -116 |
|   1.5 |    116 |
|   2.5 |    128 |
|   3.5 |    144 |
|   4.5 |    163 |
|   5.5 |    188 |
|   6.5 |    227 |
|   7.5 |    269 |
|   8.5 |    303 |
|   9.5 |    338 |
|  10.5 |    381 |
|  11.5 |    454 |
|  12.5 |    565 |
|  13.5 |    677 |
Crossing the streams, and an abrupt ending
What happens if we look at the difference between the no-vig moneylines, and what the sportsbook actually charges? Will it show us the favorite-longshot bias?
It turns out, it doesn't. The win frequency data is too noisy. I spent a lot of time spinning my wheels on it, before realizing I didn't have enough data. I will come back to the subject, though, because failure is more educational than success.