Small stakes give you the minimum blues
(This is an excerpt from a larger project about sports gambling. Code and early drafts of some of the materials can be found at https://github.com/csdurfee/book.)

I'll be talking about "the public" in this installment, by which I mean the side of a wager that gets the most number of bets placed on it.
I talk about the vig a lot without explaining it. It's explained in the book, but the short version is on standard bets, a gambler needs to win at least 52.4% of the time against the spread to break even due to needing to risk $110 to win $100. That $10 difference is the vig -- how the sportsbook makes their money.
In gambling circles, bets are often framed as Vegas or the sharps versus the public. Sharp started out as a term for cheaters -- dishonest bookies setting unfair lines, or card sharps who win thru deception rather than skill. The meaning has changed a bit over time. In modern parlance, a sharp is someone who wagers on sports as a game of skill, making money over the long term by placing bets with positive expected value. But the negative connotation persists in popular chatter about gambling. There's something unseemly about using math to decide which bets to take.
Say there's a game between the Lakers and the Charlotte Hornets, and the Hornets win against the spread. The public lost. What degenerate is betting the Hornets? Sharps, that's who. You'd think the public wouldn't have a problem with the sharps -- at least someone won money off Vegas tonight. Without the sharps, all the money that the public lost would go to Vegas. But Vegas and sharps are often conflated together. It's the public versus everybody.
It seems unlikely to me that it's always the public on one side of the bet and sharps on the other. The public is still right around 50% of the time, right? They can't be drastically worse than a coin flip, so taking the opposite bets can't be drastically better than a coin flip. That means that sharps are going to agree with the public at least some of the time. They might fade the public (bet the opposite side) more often than they agree with the public, but there's probably a fair amount of both.
How do bettors do against the spread as the season goes on?
Does the public side do better over time? If records against the spread were random and the lines totally fair, we'd expect the public's winning percentage to bounce around pretty close to 50%, spending about as much time on both sides of the line -- sometimes doing a little better than 50%, sometimes a little worse. Over the course of the season, the public's cumulative record against the spread should get closer and closer to 50%, as the sample variance gets smaller.
Here's the 2024-2025 data. This is the public's winning percentage, graphed as a 100 game moving average:
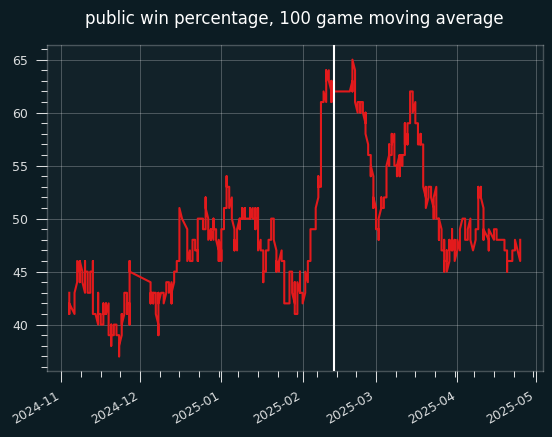
The white line is the start of the All-Star break. The public was winning well below 50% of their bets until a surge in the 100 or so games before the break, as we can see on the cumulative graph:
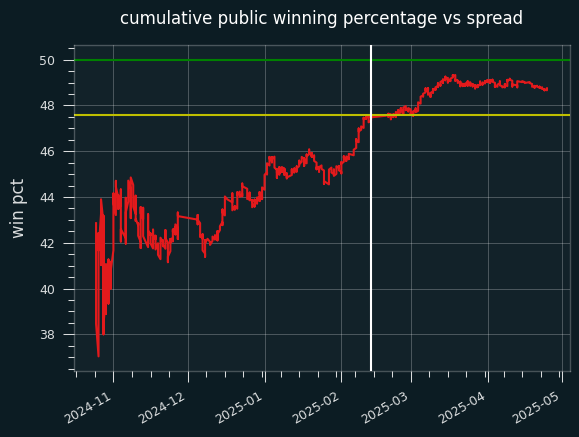
The public ended up going 584-614 on the season. Someone taking the public side of every bet against the closing line would have lost 91.4 units on the season, for a 48.75% winning percentage.
The yellow line is the break-even point for fading the public -- taking the non-public side on every bet over the season. Up until that surge before the All Star break, it would've been extremely profitable to do so. Even by the end of the year, the public's win percentage didn't get close to 50%. Someone betting at -105 reduced juice could have made .8 units by fading the public on every single bet.
The public were 369-388 when betting on the favorite, and 215-226 betting on the underdog. They went 293-311 when the away team won, and 291-303 when the home team won. They were bad no matter how you slice it.
While that's all super weird, it's only one season. My data source (sportsbookreview.com) only has spotty data for the 2023-24 NBA season, but they do have mostly complete data for 2021-22 and 2022-23. (Nothing before that, unfortunately.)
2021-22 season
I have data for 1108 out of 1230 regular season games for 2021-22.
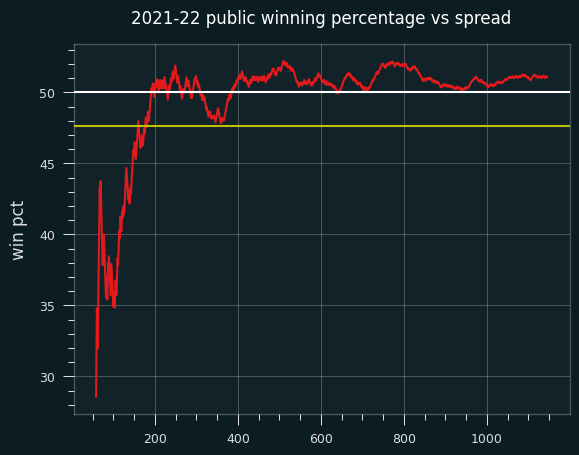
The public went 566-542 on the season, for a loss of 30.2 units, much better than 2024-25.
Here's the 100 game moving average:
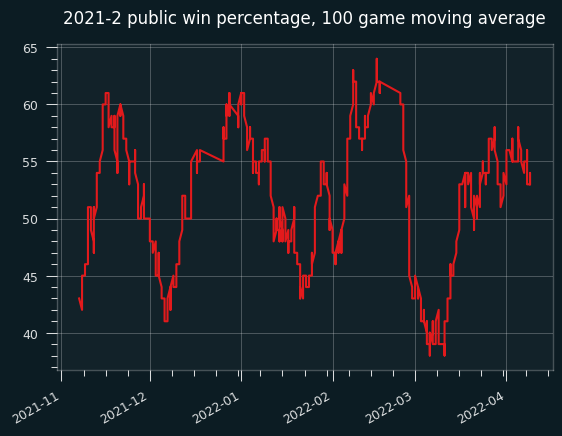
Except for a dip in early March, the public did consistently fairly well. Not well enough to make money, but better than 50% win percentage.
On the cumulative graph, while fading the public (yellow line) would have been profitable for the first month or so, the graph spends most of the season over the 50% line. However, it never gets over 52.4%.
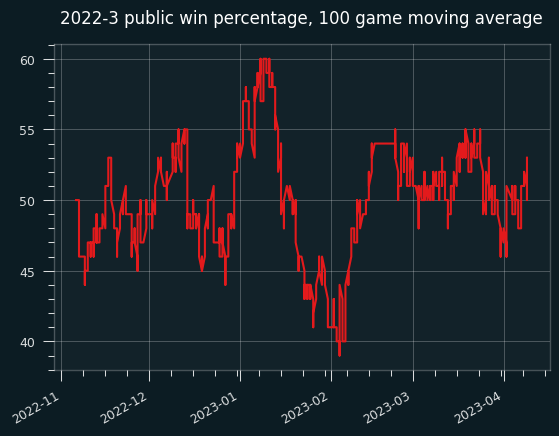
2022-23 season
I have data for 1176 off 1230 games in 2022-23.
The public went 587-589 for the season, for a loss of 61 units on the season. That's remarkably fair, if the vig weren't a factor. Here's the moving average:
And the cumulative:
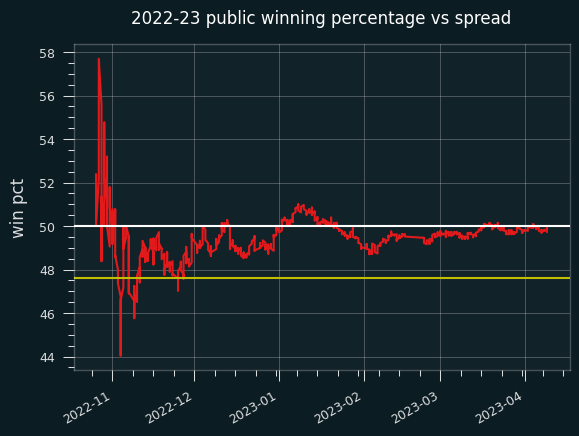
This one is similar to the 2023-24 graph, where the public pretty consistently lost a little bit more the 50% of the time, but not often enough to make fading the public a viable strategy.
Are team records against the spread random?
I started to answer this last time, but didn't have time to go deeper. If betting records are random, previous performance gives no information about future performance. Each game is like a coin flip, with equal chances of heads and tails. Teams will have good or bad records against the spread due to chance alone.
However, I gave some plausible reasons why this might not be the case.
The simplest way to test this I could think of was comparing records against the spread in the 1st half of the season to the 2nd half of the season. If the records are random, there should be no correlation between 1st half and 2nd half records.
I found there was a positive correlation between 1st half and 2nd half records in all three seasons I have data for. In 2023-24, the correlation coefficient was .10. In 2022-23, it was .40, and in 2021-22 it was .27. Only 2022-23 was statistically significant. Assuming randomness, positive and negative correlation should be equally likely. So all three being positive is suspicious. I don't think records against ths spread are totally random.
Say we track which teams had winning records against the spread over the 1st half of the season, then bet on those teams for the 2nd half of the season. (I didn't bother to filter out the games where teams with winning records play each other, so this analysis isn't perfect.)
In 2024-25, that would give a record of 297-297 ATS -- can't get more fair than that.
In 2022-23, it would have gone 279-241, for a profit of 13.9 units at standard vig, and a 53.7% winning percentage.
In 2021-22, it would have gone 247-225, for a loss of .5 units and a 52.3% winning percentage.
So, it's definitely not enough to be profitable as a strategy on its own. But it's close, and that's interesting.
A gambler needs to win at least 52.4% of the time to break even against the vig. Say they're picking from a subset of bets that have a 52.3% chance of winning, as the naive strategy achieved in 2021-22. They'd just barely need to do better than flipping a coin to be profitable. That could be much easier than picking from a set of bets with a 50% chance of winning, right?
Final thoughts
In all three seasons, the public did a little worse in the first half of the season than the second half. In the two most recent seasons, the cumulative winning percentage was below 50% for nearly the whole season.
That doesn't seem random to me. It makes sense that sportsbooks would offer slightly more favorable odds to the less popular team in order to attract equal money on both sides. It also makes sense that sportsbooks would be happy if the team with more money on it lost over 50% of the time. The difference between the public winning 50% of the time and the public winning 48.5% of the time could be significant on enough betting volume.
In all three seasons, there was a positive correlation between a team's record against the spread over the first half of the season and the second half. The correlation is strong enough that over 3 seasons, it's almost possible to make money by betting on teams with a good first half record.
On both points, I don't have nearly enough data to draw grand conclusions about how "the market" operates -- this is just one sportsbook, and an unknown one at that. Yahoo and DraftKings also provide betting percentage data, which would be useful for cross-checking these trends. I'm going to hold off for now, though -- there are too many other interesting things in the world.