The public wants what the public gets
code available at https://github.com/csdurfee/book.

Two types of people
Lots of sportsbooks publish info on how much action they've gotten on each side.
Here's DraftKings': https://dknetwork.draftkings.com/draftkings-sportsbook-betting-splits/
It's a smart move. It's good for SEO (to the extent that still matters). And I'm sure they get a lot of people who decide to take bets from that page.
For example, the Pacers were playing Brooklyn the night I wrote this. 27% of the bets were on Brooklyn at +10.5. 73% are on Pacers -10.5.
Somebody who sees that and decides to make a bet based on that information could bet either way. They could either tell themselves, "Everybody's taking the Pacers, so it must be a good bet" or "Everybody's taking the Pacers, so it must be a bad bet".
What are those two groups like when they're not betting on basketball, do you think? Do they use the same kind of toothpaste? Watch the same kind of TV shows? Vote the same way?
The public gets what the public wants
One bit of gambling lore is that there are "public" teams that get bet on more frequently, regardless of the line. Like, your cousin who's a Cowboys fan is going to bet the Cowboys on Thanksgiving regardless of whether it's a fair line or not. He'd watch the game and root for the Cowboys anyway, but it's a little more fun that way. The Cowboys aren't just a random number generator to him.
There's a social aspect to gambling now that I imagine didn't exist when it was underground. Lots of gamblers will follow bets that other people have placed. If the bet wins, I'm sure it's a cool communal thing to be a part of. But social media often doesn't obey the wisdom of crowds -- in places like reddit where users vote content up and down, the conventional wisdom is going to be amplified, and people with minority opinions are going to be suppressed. If well over 90% of sports gamblers lose money long term, the majority opinions are going to be bad.
I scraped betting percentage data from sportsbookreview (SBR) for the 2024-5 season. They don't say where they get the betting percentages from. If I had to guess, it would be MGM Grand, their primary source of other data. The SBR numbers seemed to indicate more action overall than a couple other sources I found -- the betting percentages were closer together. Other sites had games where there's 10% action on one side and 90% on the other, which seems implausible on a large volume of bets. So it's probably a pretty big site, whatever it is.
As with the data from the previous installment, there are 32 games out of 1230 missing data.
The money_percents column is the median amount bet on each team. The money_game_winners column tracks the number of games where that team got the majority of the money bet on their side. Both of these can be taken as indicators of how much teams are favored by the public.
Here are the teams sorted by money_percents. The teams near the top were less popular with gamblers, the teams at the bottom more popular.
| winner | loser | ats_win_pct | money_percents | money_game_winners | |
|---|---|---|---|---|---|
| New Orleans | 34 | 44 | 44 | 39.5 | 20 |
| Charlotte | 36 | 42 | 46 | 41.5 | 24 |
| Miami | 39 | 41 | 49 | 43 | 20 |
| Philadelphia | 26 | 52 | 33 | 43.5 | 29 |
| Portland | 45 | 33 | 58 | 43.5 | 25 |
| Orlando | 41 | 40 | 51 | 44 | 29 |
| Utah | 39 | 38 | 51 | 45 | 33 |
| Sacramento | 35 | 44 | 44 | 45 | 32 |
| L.A. Clippers | 47 | 34 | 58 | 46 | 27 |
| San Antonio | 38 | 41 | 48 | 47 | 31 |
| Chicago | 42 | 38 | 52 | 47 | 36 |
| New York | 38 | 44 | 46 | 48 | 38 |
| Phoenix | 29 | 49 | 37 | 48 | 36 |
| Washington | 33 | 46 | 42 | 49 | 37 |
| L.A. Lakers | 48 | 33 | 59 | 51 | 42 |
| Indiana | 38 | 43 | 47 | 51 | 42 |
| Atlanta | 37 | 42 | 47 | 52 | 41 |
| Boston | 39 | 42 | 48 | 52 | 43 |
| Minnesota | 37 | 43 | 46 | 52 | 43 |
| Dallas | 37 | 44 | 46 | 52 | 41 |
| Detroit | 41 | 38 | 52 | 53 | 43 |
| Brooklyn | 42 | 35 | 55 | 53 | 41 |
| Toronto | 49 | 28 | 64 | 53 | 47 |
| Golden State | 42 | 40 | 51 | 54 | 51 |
| Houston | 44 | 38 | 54 | 54 | 49 |
| Oklahoma City | 53 | 29 | 65 | 54.5 | 54 |
| Milwaukee | 44 | 38 | 54 | 56.5 | 56 |
| Cleveland | 47 | 33 | 59 | 57 | 53 |
| Memphis | 41 | 41 | 50 | 57 | 51 |
| Denver | 37 | 45 | 45 | 58.5 | 63 |
The public favorites
The most popular teams with NBA gamblers were Denver, Cleveland, Memphis, Milwaukee, and Oklahoma City. Denver got the most money in 63 of 82 games they played, which is remarkable.
Cleveland, OKC and Memphis were dominant for most of the season.
Denver and Milwaukee have two of the best and most entertaining players in the league. Both Giannis for Milwaukee and Jokic for Denver are fun to root for. People like to take bets on teams that are fun to follow.
The ugly dogs
The bottom teams were New Orleans, Charlotte, Miami, Philadelphia and Portland. All these teams except for Portland were total bummers to watch and cheer for this year. They had injuries and organizational dysfunction that led to totally wasted seasons. People don't like to take bets on teams that are a bummer to follow.
This hints at the fact that a lot of people are taking bets because they want that team to win the bet, rather than because they believe the bet has a positive expected value. It's entertainment, not a business investment.
Against the spread
Here's the same data sorted by record against the spread.
| winner | loser | ats_win_pct | money_percents | |
|---|---|---|---|---|
| Philadelphia | 26 | 52 | 33 | 43.5 |
| Phoenix | 29 | 49 | 37 | 48 |
| Washington | 33 | 46 | 42 | 49 |
| New Orleans | 34 | 44 | 44 | 39.5 |
| Sacramento | 35 | 44 | 44 | 45 |
| Denver | 37 | 45 | 45 | 58.5 |
| Dallas | 37 | 44 | 46 | 52 |
| Charlotte | 36 | 42 | 46 | 41.5 |
| Minnesota | 37 | 43 | 46 | 52 |
| New York | 38 | 44 | 46 | 48 |
| Indiana | 38 | 43 | 47 | 51 |
| Atlanta | 37 | 42 | 47 | 52 |
| San Antonio | 38 | 41 | 48 | 47 |
| Boston | 39 | 42 | 48 | 52 |
| Miami | 39 | 41 | 49 | 43 |
| Memphis | 41 | 41 | 50 | 57 |
| Orlando | 41 | 40 | 51 | 44 |
| Utah | 39 | 38 | 51 | 45 |
| Golden State | 42 | 40 | 51 | 54 |
| Detroit | 41 | 38 | 52 | 53 |
| Chicago | 42 | 38 | 52 | 47 |
| Houston | 44 | 38 | 54 | 54 |
| Milwaukee | 44 | 38 | 54 | 56.5 |
| Brooklyn | 42 | 35 | 55 | 53 |
| L.A. Clippers | 47 | 34 | 58 | 46 |
| Portland | 45 | 33 | 58 | 43.5 |
| L.A. Lakers | 48 | 33 | 59 | 51 |
| Cleveland | 47 | 33 | 59 | 57 |
| Toronto | 49 | 28 | 64 | 53 |
| Oklahoma City | 53 | 29 | 65 | 54.5 |
Philadelphia, Washington and Phoenix were just as terrible at the sportsbook as they were on the basketball court. OKC and Cleveland had outstanding seasons in both places.
However, there's only a rough correlation between how good the teams were at actual basketball, and at beating the spread. Minnesota, New York and Denver were in the bottom 10 by winning % against the spread, even though they had good records and were doing their best to win. Denver lost to the eventual champs, and New York and Minnesota made the conference finals. Indiana was the 10th worst team against the spread, and made the NBA Finals. Toronto and Brooklyn weren't really trying to win a lot of basketball games, but ended up in the top 10. There is no good reason I can think of for the Lakers to be in the top 4 against the spread -- aren't they the epitome of a public team that should be getting unfavorable lines?
Which teams should the public love and hate?
I calculated the amount of units a gambler would win or lose if they bet on each team when they got the majority of the bets. This is a sort of measure how happy the proverbial public should be about each team.
public_units is the amount won/lost betting in favor of the team. Phoenix, Sacramento, Dallas, Denver and Indiana disappointed the public the most.
| public_units | |
|---|---|
| Phoenix | -16.5 |
| Sacramento | -14.2 |
| Dallas | -13.6 |
| Denver | -12.6 |
| Indiana | -12.6 |
| Atlanta | -11.5 |
| Utah | -11.1 |
| Chicago | -10.2 |
| Minnesota | -9.5 |
| Detroit | -7.4 |
| Philadelphia | -6.7 |
| New York | -6.1 |
| Brooklyn | -5.2 |
| Washington | -5 |
| Boston | -3.2 |
| New Orleans | -3.1 |
| Memphis | -1.5 |
| Charlotte | -1.2 |
| Miami | -1 |
| San Antonio | -0.5 |
| Orlando | -0.4 |
| Milwaukee | 1.4 |
| Golden State | 2.7 |
| L.A. Lakers | 4.2 |
| Houston | 4.9 |
| Cleveland | 6.8 |
| Portland | 10.3 |
| Toronto | 11.3 |
| L.A. Clippers | 12.3 |
| Oklahoma City | 18.3 |
This is a pretty random list of teams, in both directions. It's a good illustration that gamblingball is different from basketball. It's not clear whether gamblingball is a game with an element of skill, or if it's all chance.
Are records against the spread due to chance?
If we assume that all variations are due to randomess, each game should be a coin flip whether the underdog or favorite wins against the spread.
Calculating exact odds using the binomial distribution, 94% of NBA teams should have between 33 and 49 wins against the spread over an 82 game season.
We'd expect 2 teams to be outside that range, and there are 3. Philadelphia went 26-52 in 78 games we have data for. Even if they won the other 4 games that are missing data, they'd only have 30 wins. So that record was definitely an outlier, but overall the season was about what we'd expect based on chance.
I find it very believable that some teams are more likely to have a winning record against the spread, because they are underestimated by the handicappers or the betting public. They end up getting lines that are too generous, and thus do better than expected against the spread over the long run. Toronto could be an example of that. They were bad, but they weren't really as bad as people thought.
Other teams could be inherently worse against the spread, as well. Perhaps they are super popular to bet on, so the lines tend to move against them -- a public team. Or perhaps gamblers and sportsbooks overvalue the team -- the conventional wisdom is that they'll be good when they're not. That definitely describes Philadelphia and Phoenix.
In both cases, the teams themselves aren't necessarily doing anything to be better or worse against the spread than an average team would be. It's about the perceptions of the bookmakers and gamblers. Teams can't help what bookmakers set the lines to be.
Do gamblers follow the record against the spread?
If a team's record against the spread is due solely to random error, then we've got a LeMartingale on our hands. The current record would have no bearing on the future record. So gamblers shouldn't factor it in when deciding to take a bet or not.
By the end of the season, there was a significant correlation between money percents and win percentage against the spread. I wanted to see how that might've changed over time. So I generated the table shown above for every single day of the season, and calculated the correlation on that day. Here's what that looks like over time:
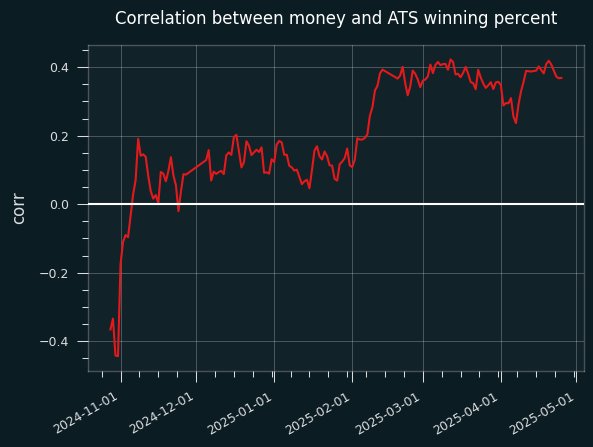
The money percentages are cumulative, the mean of all games in the season that have come before -- it's not showing gamblers' betting behavior on a particular day. The graph is a lot smoother that way, but we're losing something.
It also doesn't show whether records against the spread are a Martingale or not. The correlation between betting percentages and win records increases over time, but that doesn't mean this is because gamblers are behaving rationally.
The jump in correlation around mid-Februrary corresponds to the All-Star break, which is curious.
Stay tuned; I'll have more on this.