Lessons from four years of BetMGM NBA gambling stats

Song: The Meters, "People Say"
In a previous installment, I looked at statistics about NBA gambling that I obtained from sportsbookreview.com. I thought it was pretty interesting, but there were some huge gaps in the data, and I wasn't sure what sportsbook some of it was coming from. So I didn't have a ton of confidence in my results.
I thought it was a pretty cool idea, though, so I tracked down a better source of data via Yahoo's NBA pages. Yahoo loads gambling data from the BetMGM sportsbook, and I found a nice internal API for getting it all. I was able to get data on the past four seasons of NBA games, and although data is missing for some games, it's much more complete, and has a bunch more info, than the original dataset.
All code and data is available online at https://github.com/csdurfee/scrape_yahoo_odds/. The explore.ipynb notebook has all the calculations and charts used in this article.
As usual with gambling content, I'm presenting this data because I think it is interesting to study how it works, and what it tells us about basketball and human nature. I don't recommend you bet based on information in this article, or at all.
The data I'm looking at is every regular season and playoff NBA game from the 2021-22, 2022-23, 2023-2024 and 2024-2025 seasons. No preseason games or All-Star games, but the Emirates NBA Cup championship game is included.
There are 435 games that are missing stake/wager data (the percentage of money and bets placed on each side, respectively.) That leaves 4,840 NBA games that I have analyzed. The stake and wager percentages seem to be pretty similar to each other, so I'm just using the wager data.
What do the spreads look like? Are there any obvious biases?
The home team went 2393-2447 (49.5%) against the spread over the last 4 years. The favorite team went 2427-2413 (50.1%) against the spread in that time.
The home team was the favorite in 3044/4840 (62.8%) of games. The median spread is the home team -3.5 (favored by 3.5 points). Here are the frequencies:
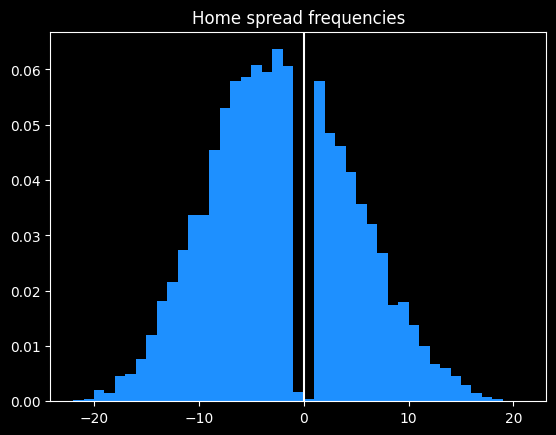
Basketball games never end in a tie, and there are strategic reasons why NBA games rarely end in a one point difference.
Around half of all home lines are one of -2.5, -1.5, -4.5, -3.5, +1.5, -6.5, -5.5, -7.5 or +2.5 (in descending order of frequency).
98.3% of all MGM lines are on the half point (eg 8.5 instead of 8). This is so the sportsbook can avoid pushes (ties), where they have to give everybody's money back.
More evidence of the folly of crowds
First, some betting jargon, if you're new here. Teams that are popular with bettors are known as public teams. The side of a particular bet that gets more action is known as the public side. If that side of the bet won, people say the public won. Betting the less popular side is known as fading the public. When the less popular side wins against the spread, people will say Vegas won or sharps won (a sharp is someone who is good at betting, as opposed to a square, who is bad at betting.)
Looking at the stake/wager data, we can find out which team was more popular to bet on for each game. How do those public teams do collectively? Are the public any better or worse at making picks than just flipping a coin?
Due to well-earned cynicism, I was expecting that the public would be a bit worse than a coin flip. And they are. The public went 2381-2459 (49.19%) against the spread over the past 4 years.
The public greatly prefer betting on the away team. 2742/4840 (56.7%) of public bets are on the away team. The public also greatly prefer favorites. 2732/4840 (56.4%) of bets are on them.
Here's how the bets break down:
| favorite | dog | |
|---|---|---|
| AWAY | 1215 | 1527 |
| HOME | 1517 | 581 |
This crosstab is a little misleading. The home team is usually favored, so there are fewer home underdogs than road underdogs. However, there's still a discrepancy. The home team is the underdog 37% of the time, but only 27% of bets on underdogs are on the home team, and 28% of bets on the home team are on underdogs.
Of the 4 categories, the only one with a winning record for the public is away favorites -- 623-592 (51.3% win rate). The second best type is home underdogs, which went 289-292 (49.7%).
The two most popular bet types with the public are big losers. Away underdogs went 742-785 (48.6%), and home favorites went a putrid 727-792 (47.9%).
Overall, someone taking the public side of every bet over the past 4 years would have lost 324 units. If they bet $100 on every game, they would be down $32,400. Someone taking the opposite side of all these bets (fading the public) would "only" lose 160 units, or $16,000.
It would've been profitable betting reduced juice (risk 106 to win 100 instead of 110) to fade the public on all away underdog and home favorite picks. The problem with that strategy is that reduced juice sportsbooks actively attract smart players, so they have sharper (more accurate) lines. A retail sportsbook like BetMGM doesn't need sharp lines because they ban any players who win too much. Against sharp lines, I wouldn't expect the strategy to be profitable.
How have teams done against the spread over the past 4 years?
Over the past 4 seasons, team records against the spread appear fairly random. The only real outlier is the Oklahoma City Thunder, who have won an astounding 59.3% of their games against the spread. This is remarkable to me because they've been one of the best and most hyped teams in basketball the past couple years. They dominated the league last season, winning 68/82 (82.9%) games, and the NBA Championship. They're not exactly an under the radar team. Yet they appear to have been underestimated by both Vegas and the betting public.
| Oklahoma City | 0.593 |
| Toronto | 0.544 |
| Boston | 0.54 |
| Memphis | 0.529 |
| Orlando | 0.528 |
| Chicago | 0.516 |
| Dallas | 0.515 |
| Cleveland | 0.508 |
| New York | 0.504 |
| Golden State | 0.504 |
| Indiana | 0.503 |
| Houston | 0.502 |
| LA Lakers | 0.5 |
| Miami | 0.499 |
| Philadelphia | 0.498 |
| Minnesota | 0.496 |
| Detroit | 0.495 |
| Utah | 0.492 |
| Denver | 0.491 |
| Sacramento | 0.49 |
| LA Clippers | 0.489 |
| San Antonio | 0.488 |
| Charlotte | 0.487 |
| Milwaukee | 0.484 |
| Brooklyn | 0.483 |
| Portland | 0.477 |
| New Orleans | 0.476 |
| Phoenix | 0.471 |
| Atlanta | 0.442 |
| Washington | 0.439 |
While it's not impossible OKC's record against the spread is due to chance alone, a 59.3% winning percentage over 332 games seems like a failure of the market.
Who are the most common favorites?
Boston has been the most dominant, being favored in 319/361 (88.4%) of their games over the past four seasons, followed by Milwaukee, Denver and Golden State.
Detroit, Charlotte, Washington and San Antonio were the most common underdogs.
| Boston | 0.884 |
| Milwaukee | 0.734 |
| Denver | 0.711 |
| Golden State | 0.707 |
| Cleveland | 0.706 |
| Phoenix | 0.691 |
| Miami | 0.608 |
| Minnesota | 0.595 |
| LA Clippers | 0.588 |
| New York | 0.572 |
| Philadelphia | 0.568 |
| Memphis | 0.56 |
| Oklahoma City | 0.557 |
| Dallas | 0.542 |
| Sacramento | 0.535 |
| LA Lakers | 0.509 |
| Atlanta | 0.498 |
| Indiana | 0.456 |
| Chicago | 0.426 |
| Toronto | 0.414 |
| Brooklyn | 0.411 |
| Utah | 0.406 |
| New Orleans | 0.385 |
| Orlando | 0.358 |
| Houston | 0.309 |
| Portland | 0.245 |
| San Antonio | 0.215 |
| Washington | 0.213 |
| Charlotte | 0.194 |
| Detroit | 0.188 |
Who are the most common public teams?
We saw the public likes to bet on the away team, and the favorite. Do they have team-specific tendencies?
They certainly do. The LA Lakers and Golden State Warriors are most popular, being the picked by the public in 72% of their games. Detroit and Orlando are the least popular, only getting the majority of bets in 31% of their games.
| LA Lakers | 0.716 |
| Golden State | 0.716 |
| Milwaukee | 0.694 |
| Phoenix | 0.607 |
| Denver | 0.603 |
| Dallas | 0.577 |
| Boston | 0.557 |
| Memphis | 0.551 |
| Chicago | 0.545 |
| Indiana | 0.541 |
| Philadelphia | 0.538 |
| Cleveland | 0.52 |
| Miami | 0.519 |
| Utah | 0.518 |
| Oklahoma City | 0.518 |
| Minnesota | 0.504 |
| LA Clippers | 0.502 |
| Brooklyn | 0.497 |
| Atlanta | 0.495 |
| New York | 0.484 |
| San Antonio | 0.436 |
| Washington | 0.425 |
| Sacramento | 0.417 |
| Houston | 0.401 |
| Toronto | 0.382 |
| Charlotte | 0.359 |
| Portland | 0.341 |
| New Orleans | 0.322 |
| Detroit | 0.314 |
| Orlando | 0.311 |
This is a very similar ranking to what I saw in the previous data -- the public don't appear to be picking bets for purely rational reasons. They like to bet on popular teams, good teams, and teams with popular players. They don't like to bet on unpopular or bad teams, even though both sides have the same chance of winning against the spread. It makes sense as an aesthetic choice, but not as a mathematical choice.
There is a bit of correlation (r = .08) between team popularity and their record against the spread. Bettors do slightly prefer to bet on teams that do well against the spread:
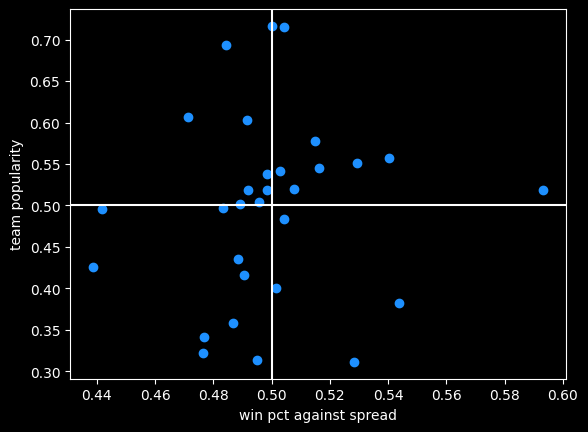
Oklahoma City is that lonely dot far off to the right, far better than every other team but only slightly more popular than average.
Money lines and the favorite/longshot bias
So far I've only been looking at bets against the spread. This new dataset also includes info on money line bets.
In some ways, money line bets are easier to understand -- just bet on the team you think will win. If you like the favorite, you will win less than you risk; if you like the underdog you win more than you risk. If it's say Oklahoma City versus Dallas, the two sides might be OKC -320 (risk $320 to win $100, implying about a 75% chance of winning) and DAL +260 (risk $100 to win $260).
With spread bets, both sides have an equal chance of winning, and are usually priced the same. But with money lines, the gambler doesn't know the true odds, so they don't know the vig they're paying.
There is data to suggest that underdogs pay more in vig, and are therefore more profitable for the sportsbook. This is called the favorite-longshot bias -- conventional betting wisdom is the expected value of taking an underdog money line bet (especially a big underdog) is lower than taking the favorite. People who bet the underdog are in essence paying a premium to have a more thrilling outcome if they do win.
While it's a documented phenomenon in horse racing, there's some debate as to whether it exists in general, so I analyzed the 4,634 games with money line betting data.
If somebody always bet the favorite on every NBA game, or the underdog, what would be their rate of return? Is it better or worse than the -4.5% rate on spread bets?
I did find evidence of the favorite-longshot bias in the NBA money lines. When risking a constant amount of money on each bet, underdogs had a rate of return of -5.47% versus -4.09% for favorites. Favorites between -200 and -400 offer the best rate of return of any type of money line bet, at -2.97%. Every single type of underdog bet does worse than -4.5% of the typical spread bet.
| label | start | end | num games | return % |
|---|---|---|---|---|
| all faves | -9999 | -1 | 4839 | -4.09% |
| mild faves | -200 | -1 | 2174 | -4.19% |
| heavy faves | -400 | -200 | 1612 | -2.97% |
| huge faves | -9999 | -400 | 1053 | -5.59% |
| all dogs | 1 | 9999 | 4634 | -5.47% |
| mild dogs | 1 | 200 | 2440 | -5.60% |
| heavy dogs | 200 | 400 | 1430 | -5.69% |
| huge dogs | 400 | 9999 | 764 | -4.65% |
The number of dogs and favorites aren't equal because some games have money lines where both sides are negative, say -110, like a traditional bet with a spread of zero. There's also a big asymmetry when the odds are long. For instance the favorite might be -800 and the underdog is +561. That doesn't represent a huge vig, it's just a quirk of how American-style odds work (covered in the book).
Caveats and bootstraps
The table above isn't telling the whole story. I'm not conveying a sense of the volatility in the rate of return. Huge underdogs have a bigger payout when they do win, so the outcomes are going to be a lot more variable than betting the favorites.
-4.65% is the best estimate of the rate of return for huge underdogs, but maybe we just got lucky, or unlucky. A couple of longshot bets winning or losing could drastically change the overall return rate.
To test volatility, I used bootstrapping, previously covered in one in e. I repeatedly randomly sampled 80% (611/764) of the huge underdog bets and calculated the rate of return on that set. Looking at the range of outcomes helps illustrate the variability of these bets.
Doing that 100 times leads to a pretty wide spread of rates of return:
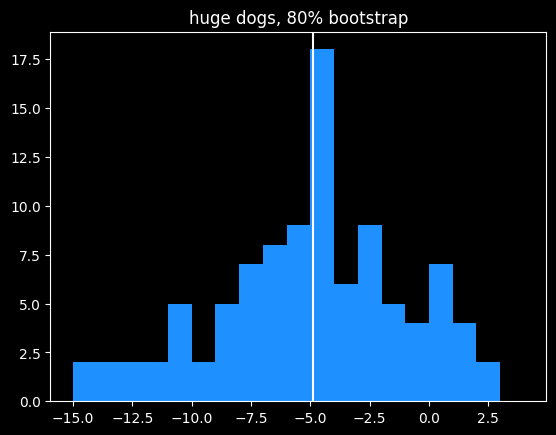
Although the mean value is close to the overall mean, 15% of bootstrapped samples actually had a positive rate of return. This is similar to what we saw in cool parlay, bro, where due to variance, even gamblers with no advantage over the house had a small chance of making money over a long period of time off of parlays. I described that situation "like a lottery where you have a 12% chance of winning $3,617, but an 88% chance of losing $10,221." This is a similar proposition.
Bridgejumper parlays and p-hacking
We'd need a lot more data to get a crisp estimate of the rate of return on huge underdogs, but we can have more confidence in the estimated -5.59% rate for huge favorites. Huge favorites being disadvantaged kind of contradicts the favorite-longshot bias theory, but it doesn't surprise me at all due to a strange phenomenon I've seen over and over again online.
It's a type of bet sharps might call "bridgejumper parlays" and squares on the internet unironically call "free money parlays" -- a parlay of a whole bunch of heavy favorite money lines together.
The gambler starts with some heavy favorite they like and keep adding more heavy favorites to the parlay till they get plus odds (they can win more than they risk), ending up with 5-6 heavy favorites on the same parlay. They will pick legs of the parlay from different sports, if necessary. There usually aren't enough heavy favorites in the NBA on a particular night to get to the magic > +100 payout.
An example you might see posted on reddit or twitter would be a 6 leg parlay with a payout of +105 like:
- Celtics -600
- Nuggets -900
- OKC -1000
- Lakers -600
- Duke -600
- Some UFC Guy, because they needed a sixth bet -700
I've talked to a couple people who take bridgejumper parlays, and they genuinely seem to think they've found some kind of glitch in the matrix -- all of the legs of the bet have a high chance of winning, therefore the bet is a sure thing.
A sensible person would know that sportsbooks aren't in the business of offering free money so maybe they're missing something. A humble person would assume they probably hadn't discovered some clever trick the sportsbooks don't know about. But most people who get into betting aren't sensible or humble (they think they can see the future, after all), so for a certain class of bettor, this type of wager just feels like a sure thing.
In parlay form, the fallacy seems obvious to me. Just because the individual risk on each leg of the parlay is small, that doesn't mean the combined risk is.
There's a more sophisticated version of this fallacy in statistics called p-hacking. As always, there's an xkcd about it. A particular experiment might have a 5% chance of giving a false result. 5% is a pretty small number. But if you do 13 of those experiments, there's about a 50% chance that at least one of them will give a false result. Even people who are good at math and science probably don't have a good sense of what $.95^{13}$ equals. It's sort of like a 13 leg parlay of money line bets at -1900.
Next time: more on point totals, money lines, and human nature.