NFL spread betting statistics: more folly of crowds

Song: Stereolab, "Wow and Flutter"
This time, I'm looking at NFL gambling statistics from the last five seasons. The data is from BetMGM, scraped from Yahoo's website (example page) via an internal API (example request).
My previous analysis of NBA betting data from the same source is available here. Code is available at https://github.com/csdurfee/scrape_yahoo_odds/.
There's not as much NFL data as I'd like, or any data nerd would. We only have 1,360 games worth of data spread over the five years since gambling was legalized. Around 140 of those games are missing data about betting percentages, so have been excluded from most of the analysis. I'm only looking at regular season games.
As usual, I'm presenting this data because I think it's an interesting window into how people and markets behave around sports. There's no reason to believe the trends I highlight here will continue in the future. It's not eternal, imperishable. Which is to say: I don't think you should bet on the information given here, or at all.
Previously, in the NBA
When I looked at the NBA, I found that a bet on the public side, the side that gets more money bet on it, wins 49.2% of the time against the spread. So there's a slight bias against the public, but not enough that somebody could make money betting the opposite way.
I was expecting something similar for the NFL. I believed that NFL lines were probably quite fair, meaning no matter how you slice the data -- home vs. away team, favorite vs. underdog, popular vs. unpopular side -- a gambler will end up losing over the long run no matter which side they take.
Turns out, that's not true.
Spreads: the popular side gets crushed
The side with a higher wager percentage (by number of bets placed) has gone 605-755 over the past 5 years. That's a winning percentage of 44.5%. Someone taking the unpopular side (fading the public) on every NFL game would've won 55.5% of their bets, for a profit of 89.5 units at standard -110 odds. That's an Expected Value of +6.6% on each bet.
Here are the winning percentages for fading the public by year:
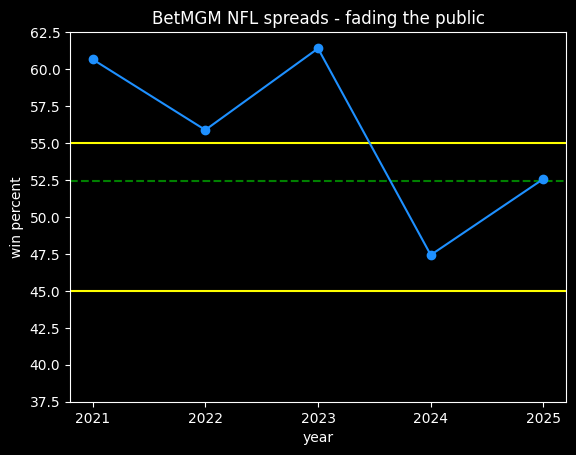
The yellow lines are a 90% confidence interval, assuming that fading the public should only win 50% of the time. 2021-2023 are outside the range we'd expect due to chance, but 2024 and 2025 have been in range, so whatever trend may have been causing the imbalance could already be gone. For instance, gamblers may have gotten more savvy over time, or the lines less imbalanced because of more market competition.
The green dotted line is at 52.4%, the minimum win rate to break even at -110 odds. The average entrant in the Super Contest has never exceeded that in 13 seasons, while fading the public has done so in 4 out of 5 seasons.
There are a fair number of games where the stake percentage (amount of money) and the wager percentage (number of bets) disagree about which side is the public side. Excluding those games leads to even more impressive results -- a 649-500 record against the spread for the unpopular side. That bumps the win percentage up to 56.5%, and +99 units at -110 odds, or +124 units at reduced juice. That's an expected value of +8.6% on each bet.
We should expect pretty much any binary slice of the data to win between 47 and 53% of the time, assuming the imbalance is due to chance. For example, the home team went 650-710 (47.8%) against the spread. The underdog went 681-679 (50.1%). Home underdogs went 260-275 (48.6%).
Of course, this is hindsight bias. Imagine if, 5 years ago, someone had proposed to always fade the public on the NFL. I would have thought it was a bad idea. Wouldn't you?
Other spread trends
The public tends to favor the away team, taking it in 724/1340 games (59% of the time).
They also generally take the favorite on the spread. They took the favorite in 877/1340 games (64.5% of the time).
Both of those trends were true for NBA basketball as well. Gamblers seem to love their away favorites. When there's an away favorite, they take it 78% of the time (415/535 games). When there's an away underdog, they take it 54% of the time (448/824 games).
Chunky spreads
Some final scores in football are more likely than others. Scorigami, yadda yadda.
That means point differentials are going to have differing degrees of likelihood. A final score difference of 3 is going to be more likely than 5, because scoring a field goal to win a tie game is more likely than the long sequence of actions that would lead to a 5 point differential. (For example, one team might be up by 8 and the other team scores a field goal.)
The spreads are an estimate of the mean outcome of every game, not a guess at the final outcome. So they'll be less widely dispersed, but they should have roughly the same shape. For more detail, see the section "What would perfect lines even look like?" here.
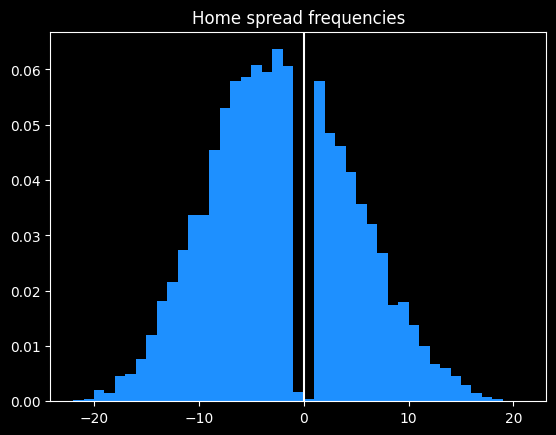
Here are NBA point spreads. Except for a bit of weirdness in the center due to NBA not having ties, and winning/losing by one point being rare for basketball reasons, it's a nice smooth curve:
Here's what spreads for the NFL look like. The lack of data isn't helping, but the overall shape clearly isn't a nice smooth curve. The spikes are much higher for certain numbers.
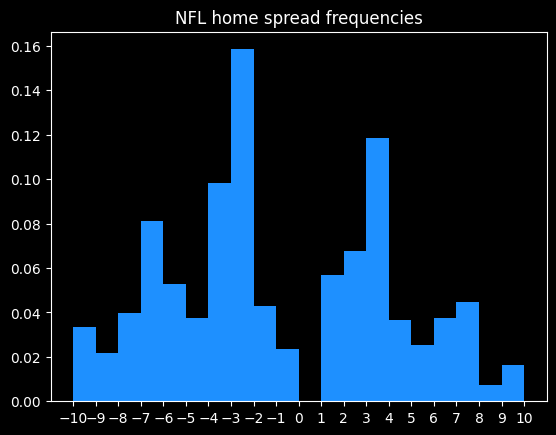
Here are the most common home spreads. These represent 73% of all NFL spreads.
|   spread |   count |   cumulative % |
|---------:|--------:|---------------:|
|     -3   |     109 |              8 |
|      3   |      90 |             15 |
|     -3.5 |      89 |             21 |
|     -2.5 |      86 |             28 |
|      2.5 |      64 |             32 |
|      3.5 |      56 |             36 |
|     -6.5 |      51 |             40 |
|     -7   |      49 |             44 |
|     -1.5 |      40 |             47 |
|      1.5 |      38 |             49 |
|     -7.5 |      37 |             52 |
|     -5.5 |      37 |             55 |
|     -4.5 |      37 |             58 |
|      7   |      35 |             60 |
|     -4   |      32 |             63 |
|      1   |      32 |             65 |
|     -1   |      28 |             67 |
|     -6   |      28 |             69 |
|      6.5 |      27 |             71 |
|      5.5 |      27 |             73 |
NFL betting is a game of 3's. 36% of lines are around +3 or -3. It's unusual to see lines that are greater than 7 or less than -7.5.
Actual point differentials
What about the differentials of actual games? I had to pull scores from another datasource, since the yahoo API only provides gambling data. I'm using the score data from pro-football-reference.com.
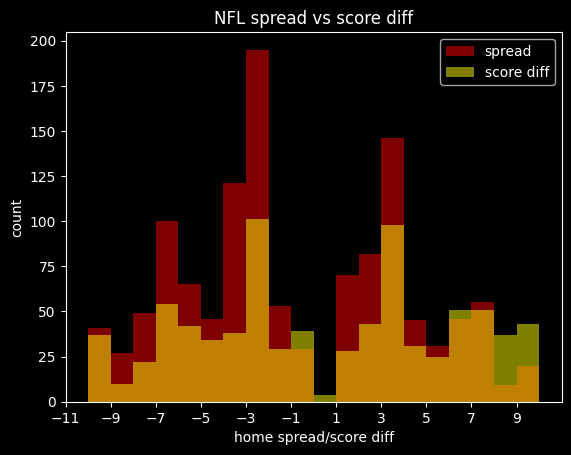
Here are spreads and final score differentials laid on top of each other. The orange part is where they overlap. The score differentials are much more dispersed, but they both show similar spikes at certain numbers:
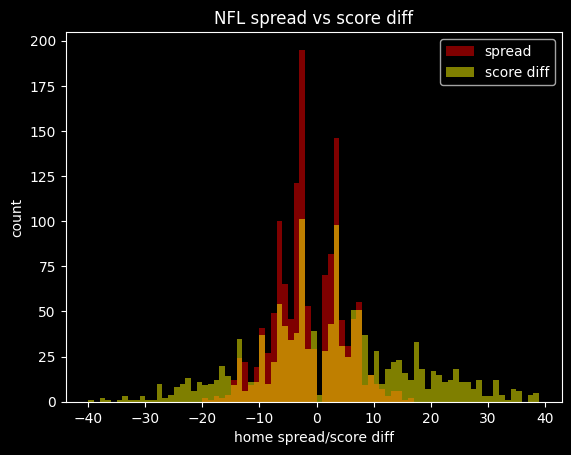
The spikes at the 3's and 7's are a bit more legible if I zoom in:
Here are the most common final score differentials for the away team -- which would be the seemingly ideal point spreads for the home team.
|   away_score_diff |   count |
|------------------:|--------:|
|                 3 |     101 |
|                -3 |      98 |
|                 7 |      54 |
|                -6 |      51 |
|                -7 |      51 |
|                -2 |      43 |
|                 6 |      42 |
|                 1 |      39 |
|                 4 |      38 |
|                10 |      37 |
|                -8 |      37 |
|                14 |      35 |
|                 5 |      34 |
|               -17 |      33 |
|                -4 |      31 |
Lots of the games end on 3's, 7's and 6's, just like the lines. Unlike the lines, none of them land on the half point.
The average outcome in the NFL is the home team winning by 2 points, so that's a decent estimate of home field advantage.
About half of all NFL games are within 8 points (a touchdown and a 2 point conversion) of the average outcome.
count    1359.000000
mean        2.062546
std        14.187563
min       -40.000000
25%        -6.000000
50%         2.000000
75%        10.000000
max        50.000000
Name: home_score_diff, dtype: float64
What do errors against the spread look like?
Let's compare the final point differential to the spread. The spread should be an unbiased estimate of the mean outcome between the two teams. We only get one data point to judge the quality of the line's estimate of the mean, which is sort of unfair, but that's just how it works with sports betting. I'll refer to the difference between the point differential and the spread as the error.
As I talked about in "Last fair deal in the country", because the line makers aren't trying to predict the actual outcome, merely the average outcome, some large errors are inevitable. The line makers can't actually predict the future, and aren't really trying to.
For example, the Miami Dolphins once beat the Broncos 70 to 20. The spread on the game was Dolphins -6, meaning it was off by 44 points relative to the final score. That doesn't mean the line really should have been Dolphins -50, though. It's hard to believe that if the game were played over and over again, the Dolphins would win by an average of 50 points, which is what a 50 point line signifies.
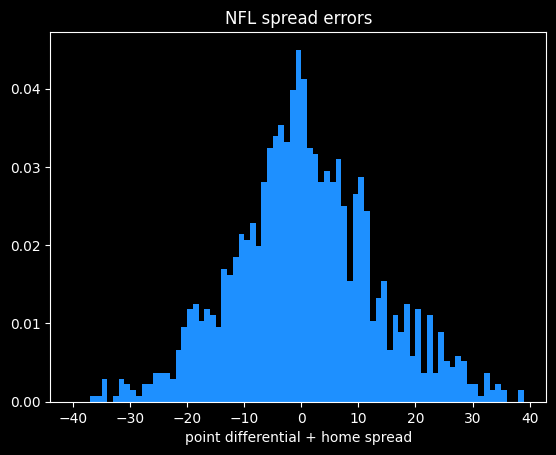
So we need to look at the errors as a whole rather than individual games to decide whether the line makers are good at their jobs or not. If the spreads are fair, the average error should be zero, and the errors should be fairly symmetrically distributed -- there should be about as many games where the error is -7 as it is +7, for instance.
Here's what the errors look like. The median is exactly zero, so kudos to the sportsbooks for that one. The right side is where the home team outperformed the spread, and the left is where they underperformed. There are a few more blowouts against the spread (more than 20 points) for the home team than the away team, but otherwise it's reasonably symmetrical.
count    1358.000000
mean        0.437040
std        12.628641
min       -37.000000
25%        -7.375000
50%         0.000000
75%         8.500000
max        44.000000
Name: spread_error, dtype: float64
Next week: much more on NFL betting.
Mathletix Bajillion, playoffs round one edition
Both teams had wicked regressions to the mean this week.
I'll finish the season out, but I'm tempted to quit, because I think I've proved my point about line shopping: both teams are essentially earning a free bet every 30 or so bets by using betting exchanges rather than retail sportsbooks.
Both teams ended up making similar picks, because there are only 6 games to choose from.
Lines taken Wednesday morning
The Neil McAul-Stars
last week: 1-4, -330
Overall: 22-22-1, -85
line shopping: +135
- CAR +10.5 +100 (lowvig)
- CHI +1.5 -109 (prophetx)
- JAX +1 -107 (lowvig)
- PIT +3 -105 (lowvig)
- SF +5 -107 (prophetx)
The Vincent Hand-Eggs
last week: 5-0, +500
Overall: 20-22-3, -287
line shopping: +133
- CAR +10.5 +100 (lowvig)
- NE -3.5 -109 (prophetx)
- BUF -1 +101 (prophetx)
- SF +5 -107 (prophetx)
- CHI +1.5 -109 (prophetx)