Mar 01, 2026

Song: "One Two Three (No Gravity)", by Closer Musik
I've been working on non-mathletix things, so I thought it would be a good time to revisit some previous topics.
Tanking in the NBA only works if a team's only problem is lack of a star player.
Otherwise, it's just a cop-out for being bad, and delays or prevents fixes to organizational problems.
Oceans of ink/pixels have been spilled about tanking, including on this very website. It's a classic example of perverse incentives and unintended consequences, and most of the fixes I've seen have their own set of issues. I worked on my own proposed solution -- basically, teams could declare themselves as rebuilding at the start of the year and have a chance at top draft picks in exchange for reducing ticket prices for fans, and receiving less in revenue sharing. My idea might fix some issues, but inevitably would create other ones. Any sufficiently complex game will have some sort of meta to it that has the potential for being exploited.
Tanking is bad (nebulously defined), but trying to fix it doesn't mean the league will become better off. It's very easy to create new issues. What would a perfect league look like? Only so many teams can be contenders at one time. What do the rest of them do, that isn't tanking, but is entertaining and interesting for fans?
As I previously talked about regarding the Kings, people point to the Thunder and Spurs as evidence that tanking works, as though it's some magic elevator to success. They both rapidly became top teams in the league after a few years of intentionally being bad. The Pistons and Rockets did, too. It's easy to draw the wrong conclusions from that.
But the Thunder and Spurs already had really good organizations before they decided to be bad. Handing talented players to organizations like the Kings, that suck at everything else, feels like a massive waste, especially when it's a multi-year tank job. Can we really trust the Wizards to develop Kyshawn George into the best version of himself?
As Keith Parrish pointed out recently on the Grits and Grinds podcast, tanking also hurts coach development and evaluation. There's no way to know if a coach is good or not if you are incentivizing them to be bad. How can a coach learn to run a playoff caliber team, or win in high-pressure situations, if the team isn't trying to be competitive at the end of games? Coaches need to develop, too.
I have some confidence the coaches of the Nets and Jazz are good, because their organizations seem to actively fight them in order to keep the tank rolling -- trading away good players, (apparently) mandating good players sit out the 4th quarter, players deciding season-ending surgeries for dubious injuries. Are they going to reach their potential as coaches, when they have to deal with all this nonsense?
The Toronto Raptors have turned the corner. Last year they were intentionally bad, and this year they're pretty good. They didn't end up with a good draft pick even after fairly shameless tanking efforts last year, though. The Jazz got fined this season for not playing their best players at all in the 4th quarter of a competitive game, but the Raptors invented that crap last season.
Was it worth losing a year of experience at being a competent basketball team in order to end up with the 9th pick instead of the 12th? That's hard to believe when the player they selected, Collin Murray-Boyles, isn't clearly better than Derik Queen (13th pick) or Cedric Coward (11th pick).
Front office staff don't count against the salary cap. It's amazing to me that some insanely rich owner like Steve Ballmer hasn't offered Sam Presti a $100M a year to GM their team. It would probably still be a value, compared to the GM the Clippers just extended, Lawrence Frank. (The GM who traded SGA and the farm for Paul George, not the "What's the Matter With Kansas" guy). Getting pantsed by Sam Presti in a trade should probably be the end of any NBA GM's career.
The favorite-longshot bias & the NBA draft
There's a favorite-longshot bias at work with the NBA lottery. Bets on longshots tend to be massively profitable for whoever is offering the bets, going back to horse races hundreds of years ago. This has continued with the rise of prediction markets, which are rife with longshot sucker bets, as this great analysis shows:
Contracts trading at 5 cents win only 4.18% of the time, implying mispricing of -16.36%. Conversely, contracts at 95 cents win 95.83% of the time. This pattern is consistent; all contracts priced below 20 cents underperform their odds, while those above 80 cents outperform.
I think people take longshot sucker bets because humans are bad at estimating small probabilities. People tend not to feel numbers in the same way every time. Context matters. 1 in 17 might seem like a good chance for a tanking NBA team to get the #1 pick, but a small chance of a negative outcome when somebody's considering a risky behavior.
The expected value of getting a top pick is also prone to bias. There's a decent probability of a top pick being a bust, and a non-top pick being a great player. Yet teams and fans treat a high draft pick as a sure thing, and middling picks as being worthless. Talent isn't fixed, though. A #15 pick in the hands of a competent organization could turn into a better player than a #3 pick for an incompetent organization.
If everyone in the NBA was healthy, my top players would be Jokic (drafted 41st overall), SGA (11th overall), Giannis (15th overall), and Wemby (1st overall). People say that the worst thing to be in the NBA is in the middle, but 3 of the top 4 players in the league right now could have been drafted there.
Who knows if they would have reached their full potential if they had been drafted by a bad organization. There are plenty of non-lottery players who can be coached up, and NBA teams need to be extremely deep now, something I think many organizations undervalue. A star player can make a big difference, but there need to be pieces around them, and tanking doesn't do anything to improve the chances of getting the other 12 guys, coaching them up, keeping them healthy, establishing an identity.
As previously discussed, four of the OKC Thunder's rotation players were undrafted or selected in the 2nd round. A team looking to emulate OKC's success could do almost everything that led to it without ever tanking.
Calculating the value of tanking requires multiplying two numbers together: the odds of getting a top pick, and the odds of that pick turning into a franchise-altering player. Multiplying two overestimates together will create an even bigger overestimate.
Stupid analytics, silly hiring process edition
The Cleveland Browns made waves this offseason for their approach to hiring a new head coach. This process required candidates to write an essay about why they wanted to coach the Browns, among other indignities.
This was billed by the team as being a data-driven, analytical approach to hiring -- as if the same franchise that decided to hire DeShaun Watson for the largest guaranteed contract in NFL history should be feeling good about their hiring process.
Naturally, it attracted a lot of ire from people who think that analytics are bad, a way for nerds to feel like they're a part of sports they don't have the talent to play. The Browns are so obviously a stupid team. If they're trying to use analytics, that's proof that analytics are stupid, too.
There's some anti-intellectualism to this view, but it's not wrong when it comes to recognizing the Browns' approach is ridiculous. The reason to use analytics is to get a better, more unbiased view of sports or business or whatever. It's not enough to performatively use data, you have to use the right data in the right way, or it won't increase the odds of success.
Forcing a potential NFL coach to write a personal essay in order to get hired is a data-driven approach only in the most trivial sense. Yes, the Browns are collecting data, and basing their hiring decisions on it. But the data and the process are stupid on the face of it.
There's no reason to believe there's a correlation between being good at writing essays and being good at winning football games. Even if it had slightly positive predictive value, it's also annoying to the applicant. That probably lowers the average talent level of candidates, which will already be lower than average because they're the freaking Browns, and nobody with better options is going to apply anyway. It's adverse selection -- the sort of coaches willing to jump through their hoops are probably lower quality than ones that aren't.
The NFL combine
The NFL combine was last week. I previously covered the combine in the early days of this website. (Check it out -- it's got nice visualizations.) Many players are getting buzz from how well they did in the combine, and may have earned themselves millions of dollars by increasing their draft position, so good for them. But the combine has the potential to be stupid analytics.
Performance at the combine is definitely correlated with how high a player is drafted, but to quote the great movie Moneyball, "we're not selling jeans here. We're not looking for Fabio." The NFL is not a beauty pageant, and being a freak athlete is less valuable at the pro level, where nearly everyone is a freak athlete. The less disparity in physical abilities, the more the intangibles like mental acuity, emotional temperament, and staying healthy (which is both a skill and a talent) matter. Because drafting is such a big decision, it's perhaps natural to overfocus on the things that can be measured, like the combine, rather than the important things that can't be measured.
I've found little evidence that performance at the combine predicts how good a player will be in the NFL. I don't care about the combine, but anyone who thinks the combine matters should probably be able to prove it. The safe assumption is that it just leads to bias.
Player comps
The final bit of stupid analytics I want to touch on is player comparisons in draft guides. Articles about the NBA or NFL draft will often name a couple similar players to a prospect to give readers a feel for how they play.
It's not a bad idea, in theory. But the comps often aren't about a player's style, or how good they are, but about the innate biases of whoever's doing the comp. This NBA draft website's entry for Australian big man Rocco Zikarsky led me to some of the most egregious examples of racial profiling I've seen in sportswriting:

Superficially, Zikarsky is extremely tall, extremely white, and extremely Australian. The two comps the site gives are Mark Eaton (extremely tall, extremely white) and Luc Longley (all three). I guess it's technically "analysis", but crap like this undoubtedly does more harm than good. People who read analysis like this are less well-informed about the NBA for having read it. Bad data can be a lot worse than no data.
The site loves intra-racial comparisons, to the point that it almost seems like a running joke.
Their comps for Johnny Furphy are Sam Dekker and Gordon Hayward, two more white guys. Gradey Dick also gets compared to Hayward. Egor Demin is compared to Josh Giddey and Svi Mykhailiuk. Danny Wolf is compared to Henry Ellenson and Moritz Wagner. Brooks Barnhizer is compared to Dean Wade. Reed Sheppard is compared to Mark Price and Jimmer Fredette. Donovan Clingan is compared to Jakob Poetl and Walker Kessler. Chet Holmgren is compared to Kristaps Porzingis. Christian Braun is compared to Chase Budinger. Nikola Jokic is compared to Nikola Vucevic.
Kon Kneuppel is compared to Chris Mullin, another white guy, and Jared Dudley, a light-skinned black guy. That's as close to color-blind as they get.
The one that makes me think it's trolling is Ryan Kalkbrenner being compared to Ante Tomic, who I had to look up. He never played a minute in the NBA but was drafted in the 2nd round in 2008. How is that comparison useful for an NBA fan, when describing a player drafted in 2025? Anyone with enough hoops knowledge to know Ante Tomic should be able to think of a comparison that actually played in the league.
Sheesh. Nearly all these comparisons are laughable based on how the guys actually play. If their player comps are so obviously bad and biased, why should anyone trust the rest of their analysis? I'm not really a fan of the draft preview subgenre of sportswriting and am admittedly not the target market. Maybe the predictive power of the stories doesn't matter, like with gambling podcasters, and their cool bro stories. Why is this the story that draft enthusiasts want to hear?
Quick math time
Around 1 in 5 NBA players are white. Unless you assume there's some link between race and basketball playing style, the chances of a player's two best comps both being white should be 1 in 25, or 4%. The chances of a player having two black comps should be 64%, or 16x higher.
There should be 4x as many black players with two white comps than white players with two white comps, because there are 4x as many black players overall. Yet I've never seen a black player get two white comps, and it's pretty rare for a white player to get two black comps. Usually the comps aren't quite as blatantly biased as this site's, but there's always a little stench of it.
Last year, there was some controversy when Isaiah Hartenstein described himself as "bright skinned", because his father is half Black. Now, I have zero authority, and even less desire, to judge who should call themselves Black or not. But we can use this crappy website to make a Cleveland Browns-style data driven decision on the matter. Hartenstein's pre-draft comps? Donatas Motiejunas and Dino Radja, two white guys. That settles it!
Feb 01, 2026

Song: Kids See Ghosts, "Kids See Ghosts"
Spreadsheet here
Notebook: https://github.com/csdurfee/csdurfee.github.io/blob/main/notebooks/NFL-win-totals.ipynb
Some stats courtesy of pro-football-reference.com
Before the first game of the NFL season, I captured the power rankings from 11 media sources, as well as odds on pre-season win totals from a couple of sportsbooks. I thought it would be interesting to see how the power rankers did.
2025 was a strange one
We've previously seen that gamblers have done historically badly this NFL season.
The betting markets severely underestimated both teams that made the Super Bowl. The Patriots' preseason over win total was 8.5 +105, meaning a slightly less than 50% chance of winning 9 games or more. The Patriots were expected to have the easiest strength of schedule in the NFL, so that was a pretty modest number.
The only team that exceeded their win total by more than the Patriots was the Seattle Seahawks. Their preseason over win total odds were 7.5 -139. (The -139 odds implies there's a 139/239 = 58% chance of the bet winning.)
The Patriots had an average rank of 22nd in the preseason power rankings, with the highest ranking being 17th, and the lowest 27th. The Seahawks had an average rank of 19th, with the highest being 16th and the lowest 27th.
There were a lot of disappointing teams this year. Of the top 7 highest ranked teams at the beginning of the season, only one of them, the Buffalo Bills (#3 average rank) won a playoff game. The Eagles (#1 average rank) and Packers (7th) lost in the first round. The Ravens (2nd), Chiefs (4th), Lions (5th) and Commanders (6th) didn't even make the playoffs.
The teams that the Seahawks and Patriots beat to make the Super Bowl were a lot closer to preseason expectations. The Denver Broncos were ranked 10th on average, and the Los Angeles Rams were ranked 8th.
While the 4 lowest ranked teams (Giants, Titans, Browns and Saints) were all bad, the Colts and Panthers also ranked in the bottom 6 on average, and had very good seasons. The Colts looked like one of the best teams in football for a big chunk of the season, before injuries took hold. The Panthers made the playoffs, and almost won.
Comparing expert rankings to SRS
Pro-football-reference.com has a statistic called SRS, which is the average margin of victory, adjusted for strength of schedule. So it should be a better metric for comparing teams than their actual win-loss record, or average margin of victory. Because the NFL schedule is so short, it's important to use an adjusted metric like SRS.
Comparing preseason power rankings to SRS, the teams that defied expectations the most were the Colts, Jaguars, Seahawks, and Patriots (better than expected), and the Commanders and Bengals (worse than expected).
Who had the most accurate preseason power rankings?
I calculated the correlation between the power rankers and regular season SRS. USA Today was the most accurate, and Inside the Lines (CBS) was the least accurate.
|
corr |
| Inside the Lines (CBS) |
0.345 |
| FOX Sports |
0.354 |
| NFL Spin Zone |
0.354 |
| CBS Sports |
0.404 |
| NFL.com |
0.429 |
| Sharp Football Analysis |
0.431 |
| Sporting News |
0.435 |
| ESPN |
0.447 |
| DirecTV |
0.449 |
| TeamRankings.com |
0.488 |
| USA Today |
0.494 |
These correlations are far lower than what we saw with NBA power rankings a while back.
The worst power ranker, Inside the Lines (CBS), used a statistical model, but it sounded like baloney, so I wasn't surprised they did poorly. Here's how they describe their model:
we have reverse engineered oddsmakers' models which has resulted in 85-90% of our projections being virtually identical to the oddsmaker's lines (main markets and props). When sportsbooks' lines differ from ours, we know they are likely manipulating a line to either sucker the public or minimize risk.
Their model is so good that when its predictions differ from reality, we should assume reality itself is wrong or somebody's being dishonest! Good grief. Lord grant me the confidence of a bottom tier tout.
They claim they've gone 72-47, 60.5%, +18.5 units over the last three seasons but I couldn't find any record of those picks. If they were taking the games at even odds, they would be up +20.3 units, so they're taking some bets that should win more than 50% of the time, which makes the winning percentage look artificially better. We previously saw a tout known as "The Commish" over at FTN doing the same thing.
Which 2025 NFL records are misleading?
By point differential, the Patriots were the 3rd best team in the league, but by SRS, they were 6th, behind three teams from the NFC West (Seahawks, Rams and 49ers).
Due to being in the same division as two powerhouse teams, the Cardinals and 49ers had the biggest discrepancies between margin of victory and SRS -- they were probably better than their win-loss record. In the other direction, the Patriots, Broncos, Bills, Cowboys and Dolphins benefitted the most from playing an easy schedule.
Are the 2025 Seahawks historically great?
There was no disagreement at the top. The Seahawks and Rams were #1 and #2 in both SRS and margin of victory. That may be underselling how good they were. According to DVOA, a more sophisticated way of assessing team strength than SRS, both the Rams and Seahawks were among the top 10 teams in NFL history.
That's pretty remarkable to me. My instinct is that DVOA isn't adjusting to changes in the football rules or strategy over time, because it's hard to believe that a team quarterbacked by Sam Darnold is one of the 10 greatest of all time. But what do I know? I'm a guy who gets most of his football news from Tom Grossi's "If the NFL was scripted" videos.
I'm not sure anybody knows anything about football, though. The Seahawks' average preseason rank was 19th. Is it possible a team that 11 football experts thought would be below average was actually historically great? Football is way less knowable than other sports because of the short season, the large number of players, and the outsized influence of the quarterback.
Even with that in mind, these power rankings have not aged well. 6 out of 11 rankers (CBS Sports, USA Today, DirecTV, NFL Spin Zone, TeamRankings.com, Sharp Football Analysis) put the Arizona Cardinals ahead of the Seahawks at the beginning of the season. The Cardinals finished with a 3-14 record, the worst in the league, while the Seahawks went 14-3, the best in the league. It's hard to be wronger than that.
The Seahawks defense may have been historically great this season, but none of the power rankers seemed to have a clue that would happen. Considering the Seahawks went 10-7 and had the 11th best defense the prior season, the low rankings are puzzling.
Here's everything NFL Spin Zone had to say about the Seahawks:
Seattle might have something special on their hands with Jalen Milroe, but he is definitely a raw prospect and will absolutely need some time to turn into an NFL-caliber passer. Sam Darnold could be competent in the meantime, though.
USA Today didn't remark on the defense, either:
Seattle Seahawks (15): As a member of the Vikings, QB Sam Darnold dealt the 2024 Seahawks a death blow last December in Lumen Field. Now the 12s can only hope he's the real deal and won't serve a self-inflicted coup de grâce in November.
The Sporting News at least mentioned it:
Seattle Seahawks (18): The Seahawks are feeling overall about their offensive state in Year 2 with the changes to Sam Darnold and Klint Kubiak but to compete for a playoff spot in the NFC West, Mike Macdonald's defense needs more impactful results.
The Cardinals played in the hardest division in the NFL and their quarterback got injured after five games, so some of their futility is understandable. But after seeing the season play out, it's hard to imagine any possible scenario where the Cardinals were going to be better than the Seahawks, even if a majority of football experts thought so before the season.
Hindsight bias is a heck of a thing. It seems obvious in retrospect that the Chiefs (the consensus 4th best team before the season) have been losing steam for a while and didn't do enough to keep up with Father Time. Of course the Bengals (11th) were going to be terrible on defense, and the Panthers (27th) were significantly more talented and better coached than the Jets (26th) or Raiders (25th).
These all would've been hot takes just a few months ago, though. It's not like there was a lot of disagreement on the preseason rankings. Most of the power rankers had a correlation of .9 or higher with each other. The conventional wisdom, or whatever these handicappers are using, was just way off this year. Everybody's bad at this.
Another bad football handicapper
TeamRankings.com had the 2nd most accurate power rankings. They also sell picks against the spread. We've previously looked at a bunch of football touts, and they've all lost money this season. TeamRankings is the first exception to that, though just barely.
They went 149-130 on their "TR Picks" this season, for a 53.4% winning percentage and +5.5 units of profit. However, they've gone 493-479 (50.7% win percentage, -30.8 units) over their past 1,000 picks. So, like the average entrants in the Super Contest, they're a little better than flipping a coin, but not good enough to beat the vig.
They also offer algorithmic picks based on their power rankings, which are notably bad. Those went 126-153 (45.2% win percentage) this season, and 454-518 (46.7% win percentage) over the last 1000 bets. Fading those picks would've made +14.4 units this season.
Their power rankings were relatively good, but that doesn't mean they're useful for deciding which side of the line has more value. It's not enough to know which team is better than the other one -- anybody who follows the NFL could probably tell you that. A gambler has to accurately estimate how much better in order to identify positive EV bets.
TeamRankings charges $299 a year for a subscription.
nflpickwatch: A smorgasboard of bad football handicappers
I came across another site that sells picks in the course of writing this.
nflpickwatch.com is yet another website that sells NFL football picks, aggregated from experts across the internet, including writers for ESPN, the New York Post, and Bleacher Report.
They have 181 NFL experts on the site this year. Of those 181 experts, 84% of them lost money this season. If the experts made their picks randomly, we'd expect around 22% of them to be making money, so 16% is bad. 99 of the 181 experts (55%) had below 50% winning percentage. Once again, people who get paid to talk football for a living are significantly worse than a coin flip.
The site also has a section for fans to make their picks. 551 out of 2,682 (20.5%) fans made money this year. That's still worse than we'd get from flipping a coin, but better than the experts.
The experts have done better at times in the past. Here are the percentage of experts that made money (won over 52.4% of their bets) by year:
| season |
profitable touts |
percent |
| 2025 |
29/181 |
16 % |
| 2024 |
77/170 |
45% |
| 2023 |
75/246 |
30% |
| 2022 |
37/226 |
16% |
| 2021 |
61/234 |
26% |
| 2020 |
23/172 |
13% |
| 2019 |
16/66 |
24% |
| 2018 |
5/45 |
11% |
The touts were better than the 22% rate we'd expect from flipping coins in 4 of the last 8 seasons, and worse in the other 4. Combining all 8 seasons together, 323/1340 tout-years were profitable, a 24% rate.
So in aggregate, they may be a tiny better than flipping coins, but even in the very best season, the majority of touts on the site would lose you money if you took their picks.
At least they're a little cheaper than TeamRankings -- only $180 a year for the chance to lose money playing somebody else's picks.
Who's paying for this stuff, and how do I get a taste? It's easier to get people to pay for bad advice than it is to get them to follow good advice given freely. If you tell people you can see the future, they will pay for your predictions even if they're worse than random, but if you show them evidence that nobody can see the future, they'll refuse to believe you, if they even bother to listen in the first place.
The Mathletix Bajillion, final edition
I forgot to do picks last week, so I guess that's the end of the experiment. Both teams went 2-2 the prior week, meaning the Hand-Eggs finished with a record of 27-26-1, and the McAul-Stars finished at 26-24-4. The Hand-Eggs lost a tiny bit of (fake) money on the season and the McAul-Stars made a tiny bit. At full juice, both teams would've lost money despite having winning records.
I was going to reveal which team was picking bets by chance, and which was using a simple algorithm, but since they ended up getting very similar results, I guess it doesn't matter which is which, right?
Although it was a small sample size, I think I showed that betting reduced juice can save a substantial amount of money. I don't think it's reasonable to expect to make money betting on the NFL, but betting reduced juice is at least less irrational than using a retail sportsbook like DraftKings that spends over $100 Million a month on advertising.
The Ringer have been slightly more respectable the past few weeks, and they now have 2 of 5 teams with winning records (but still losing money against the vig). Collectively, the Ringer have a 242-273 record, for a 47% winning percentage. The three gambling podcasts had the three worst records, with one going 47-56 (-14.6 units), and the other two at 45-58 (-18.8 units apiece).
Jan 10, 2026
Song: Sam and Dave, "Hold On, I'm Coming"
Code: https://github.com/csdurfee/scrape_yahoo_odds/blob/main/explore_football.ipynb
This week, more insights into NFL betting from BetMGM gambling data (harvested from Yahoo). I'm looking at the last 5 seasons of regular season NFL games (2021-2022 thru 2025-2026). There are 1,359 games total, around 140 of which are missing betting percentage data, so have been excluded from parts of this analysis.
Point totals
Gamblers can wager on whether the total number of points scored in an NFL game will be over or under a certain number. These bets are sometimes called over/unders.
Spreads are a wager on the difference in team scores, and point totals are a wager on the sum. It's kind of an odd bet, because it doesn't matter which team wins. All bets are math problems, but over/unders are more obviously so.
The over has won 48.4% of the time (658/1359 games). Point totals almost never push (hit the number exactly, meaning neither side wins). That's only happened in 12 of 1358 games. About 60% of point totals are on the half point (6.5 instead of 6, for example), so they can't push.
The win rate for overs has changed over the past 5 seasons. The over won about 46% of the time from 2021-23, and 53% of the time from 2024-25. That possibly mirrors what we saw last time -- it was wildly profitable to fade the public on spread bets from 2021-23, and wasn't the last two seasons. I don't have a good theory as to why the win percents mirror each other.
Taking the under is usually equivalent to fading the public, because as with the NBA, the betting public greatly prefers the over on point totals, taking them 86.8% (1056/1217) of the time. When the public takes the over, they win 48.1% of the time. On the rare occasions where they take the under, they win 46.6% of the time. So, this is yet another example of where gamblers as a whole do worse than a coin flip. In 3 of the 5 seasons, they did poorly enough that fading their picks would have been profitable.
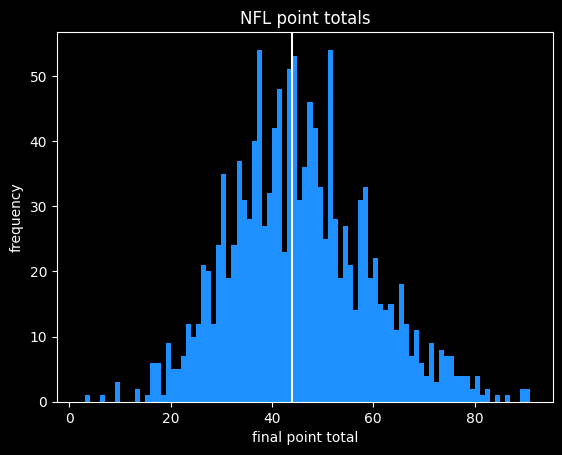
Half of all point total spreads are between 41.5 and 47.5, with the median being 44.5. A naive betting strategy would be to assume that low point totals are too low (always take the over if the total is less than 44.5), and high point totals are too high (take the under if the total is greater than or equal to 44.5). This strategy would've gone 700-658 (51.6%). It's not much, but there might be a slight advantage to betting on boring point total outcomes.
Here are the win rates for betting on the over, by point total range (split by quartiles):
| start (>) |
end (<=) |
over won |
over lost |
over win percent |
| 0 |
41.5 |
211 |
185 |
53.2% |
| 41.5 |
44.5 |
161 |
200 |
44.5% |
| 44.5 |
47.5 |
151 |
140 |
51.9% |
| 47.5 |
max |
134 |
176 |
42.2% |
Some of the variation is just noise, but based on this breakdown, taking overs on high point totals seems like a bad move.
Here are what the actual point totals look like:
Point total errors
Here are what the errors against the point total look like. Positive values are games that went over the total, negative are games that went under.
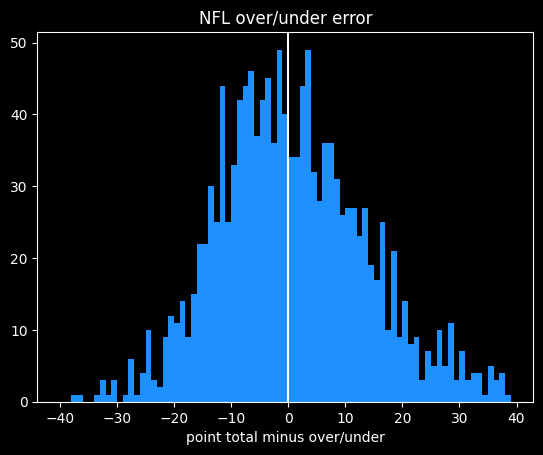
The median error is -0.5, so the errors are fairly balanced even if the graph isn't symmetrical. As with other NFL data, there are spikes because some point totals are more likely than others.
There's a longer tail to the positive side than the negative -- it's impossible to score fewer than 0 points, which limits how far under a bet can go, but there's theoretically no limit to how many points the teams can score in the over direction.
Here's how the total errors break down.
count    1358.000000
mean        0.767305
std        13.402751
min       -37.500000
25%        -8.500000
50%        -0.500000
75%         9.000000
max        57.500000
Point totals are off by an average of 10.6 points. Here are the details about the absolute value of the error:
count    1358.000000
mean       10.561119
std         8.282722
min         0.000000
25%         4.000000
50%         8.500000
75%        14.500000
max        57.500000
NFL money lines and the favorite-longshot bias
A money line bet is the simplest type of bet to understand, because it's a wager on who will win the game outright. A bet on the underdog will pay out more than you have to risk, because it's less likely to happen.
Money line data is always going to be high variance -- one +400 bet winning or not can wildly change the Expected Value. That was a problem with the NBA, which has 5x the games of the NFL, so it's definitely going to be a problem here.
The public's money line picks do better than their spread picks. They're making an average of -3.1% on money line bets, which is a step up from the -6.7% they're doing on the spread. That mirrors the NBA, where the public does significantly better on the money line than spread bets.
The public is also a slightly better Expected Value than taking money line bets randomly. The public are saved by their love of favorites, which they took in 96% (1181/1228) of games, and are a relatively good deal on the money line.
Each bet has two sides. Underdog money lines on NFL football are a bad bet in general (-7.3% EV), but huge underdogs are especially bad (-29.7% EV). This is evidence of the favorite-longshot bias in NFL betting. A -30% EV puts longshot underdog money lines in the same league as the biggest sucker bets you can take -- Same Game Parlays, 4+ leg parlays, and teasers.
"EV %" is the expected value of taking every bet in each category. Overall, money line bets have a -5.5% EV.
| label |
start |
end |
num games |
EV % |
| all favorites |
-9999 |
-1 |
1271 |
-3.9% |
| mild favorites |
-200 |
-1 |
662 |
-2.8% |
| heavy favorites |
-400 |
-200 |
406 |
-7.5% |
| huge favorites |
-9999 |
-400 |
203 |
-0.2% |
| ---------------- |
---- |
---- |
---- |
------ |
| all dogs |
1 |
9999 |
1185 |
-7.3% |
| mild dogs |
1 |
200 |
663 |
-5.4% |
| heavy dogs |
200 |
400 |
399 |
-3.4% |
| huge dogs |
400 |
9999 |
123 |
-29.7% |
| ---------------- |
---- |
---- |
---- |
------ |
| everythang |
-9999 |
9999 |
2456 |
-5.5% |
That -29.67% for huge dogs is hiding a big discrepancy. Huge home dogs (>= +400) have actually made money, winning 8/31 games. Huge away dogs have only won 6/92 games, for an absurd -63% Expected Value. The average odds for these bets is +600 (1 in 7 chance of winning), so we'd expect 13 of 92 bets to win, not 6.
Like I said at the top, money line dogs are going to be extremely variable, and the +400 number is a totally arbitrary cutoff. But even if huge away dogs had won twice as often, they'd still be unprofitable. Woof!
Money line favorites turn out to be a slightly better value than spread bets. But the estimated EVs are very sensitive to changes. I've been working on this project for a couple of weeks now, and noticed the numbers changing pretty significantly over the last 2 weeks of the NFL season. So the estimates are not telling the whole story about the range of possible outcomes.
Bootstrapping money lines
Since every bet has a different payout, they're not going to follow some nice, polite distribution. In order to estimate the variance in outcomes, I'm going to use bootstrapping, a popular technique in these parts.
I'm using the scikits-bootstrap library to generate a 90% confidence interval for the Expected Values. It samples random subsets of the bets in each category and calculates the EV of each subset. Then it returns the 5th and 95th percentile outcomes, which is a plausible range of values for the EV.
| label |
start |
end |
num games |
5th %ile |
EV |
95th %ile |
| all favorites |
-9999 |
-1 |
1271 |
-7.2% |
-3.9% |
-0.6% |
| mild favorites |
-200 |
-1 |
662 |
-8.3% |
-2.8% |
2.4% |
| heavy favorites |
-400 |
-200 |
406 |
-13.0% |
-7.5% |
-2.6% |
| huge favorites |
-9999 |
-400 |
203 |
-5.3% |
-0.2% |
4.0% |
| ---------------- |
---- |
---- |
---- |
------ |
--- |
----- |
| all dogs |
1 |
9999 |
1185 |
-14.0% |
-7.3% |
-0.2% |
| mild dogs |
1 |
200 |
663 |
-12.6% |
-5.4% |
2.3% |
| heavy dogs |
200 |
400 |
399 |
-16.5% |
-3.4% |
10.5% |
| huge dogs |
400 |
9999 |
123 |
-55.3% |
-29.7% |
4.7% |
| ---------------- |
---- |
---- |
---- |
------ |
--- |
----- |
| everythang |
-9999 |
9999 |
2456 |
-9.1% |
-5.5% |
-1.7% |
Those are some pretty wide confidence intervals. Even the big categories like all favorites lead to a wide range of outcomes.
Even with the -29.7% EV for huge dogs, we can't rule out some small hope that somebody could make money taking them, I suppose. But as always, if there's randomness involved, we don't get to pick whether we get the 5th percentile result, the average result, or the 95th percentile result.
Mathletix Bajillion, playoffs round 2
After a dramatic 10-0 run by the Hand-Eggs, both teams are now in the black for the season.
Lines taken Wednesday morning
The Neil McAul-Stars
last week: 3-2, +88
Overall: 25-24-1, +3
line shopping: +143
- BUF +1 -101 (prophetx)
- SF +7 +104 (prophetx)
- NE -3 -109 (prophetx)
- CHI +4 -104 (prophetx)
The Vincent Hand-Eggs
last week: 5-0, +501
Overall: 25-22-3, +214
line shopping: +134
- NE -3 -109 (prophetx)
- SEA -7 -108 (prophetx)
- BUF +1.5 -107 (prophetx)
- LAR -3.5 -110 (prophetx)
Jan 07, 2026

Song: Stereolab, "Wow and Flutter"
This time, I'm looking at NFL gambling statistics from the last five seasons. The data is from BetMGM, scraped from Yahoo's website (example page) via an internal API (example request).
My previous analysis of NBA betting data from the same source is available here. Code is available at https://github.com/csdurfee/scrape_yahoo_odds/.
There's not as much NFL data as I'd like, or any data nerd would. We only have 1,360 games worth of data spread over the five years since gambling was legalized. Around 140 of those games are missing data about betting percentages, so have been excluded from most of the analysis. I'm only looking at regular season games.
As usual, I'm presenting this data because I think it's an interesting window into how people and markets behave around sports. There's no reason to believe the trends I highlight here will continue in the future. It's not eternal, imperishable. Which is to say: I don't think you should bet on the information given here, or at all.
Previously, in the NBA
When I looked at the NBA, I found that a bet on the public side, the side that gets more money bet on it, wins 49.2% of the time against the spread. So there's a slight bias against the public, but not enough that somebody could make money betting the opposite way.
I was expecting something similar for the NFL. I believed that NFL lines were probably quite fair, meaning no matter how you slice the data -- home vs. away team, favorite vs. underdog, popular vs. unpopular side -- a gambler will end up losing over the long run no matter which side they take.
Turns out, that's not true.
Spreads: the popular side gets crushed
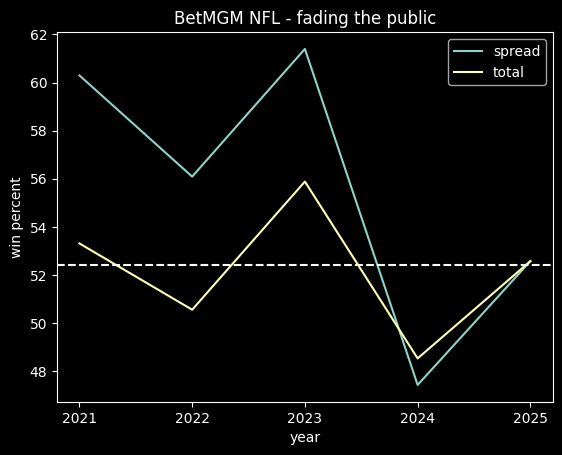
The side with a higher wager percentage (by number of bets placed) has gone 605-755 over the past 5 years. That's a winning percentage of 44.5%. Someone taking the unpopular side (fading the public) on every NFL game would've won 55.5% of their bets, for a profit of 89.5 units at standard -110 odds. That's an Expected Value of +6.6% on each bet.
Here are the winning percentages for fading the public by year:
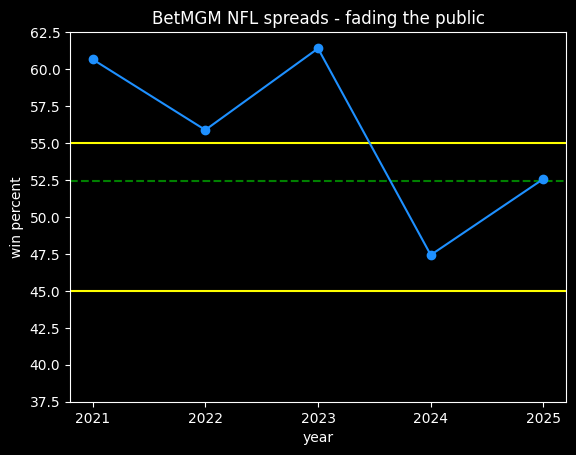
The yellow lines are a 90% confidence interval, assuming that fading the public should only win 50% of the time. 2021-2023 are outside the range we'd expect due to chance, but 2024 and 2025 have been in range, so whatever trend may have been causing the imbalance could already be gone. For instance, gamblers may have gotten more savvy over time, or the lines less imbalanced because of more market competition.
The green dotted line is at 52.4%, the minimum win rate to break even at -110 odds. The average entrant in the Super Contest has never exceeded that in 13 seasons, while fading the public has done so in 4 out of 5 seasons.
There are a fair number of games where the stake percentage (amount of money) and the wager percentage (number of bets) disagree about which side is the public side. Excluding those games leads to even more impressive results -- a 649-500 record against the spread for the unpopular side. That bumps the win percentage up to 56.5%, and +99 units at -110 odds, or +124 units at reduced juice. That's an expected value of +8.6% on each bet.
We should expect pretty much any binary slice of the data to win between 47 and 53% of the time, assuming the imbalance is due to chance. For example, the home team went 650-710 (47.8%) against the spread. The underdog went 681-679 (50.1%). Home underdogs went 260-275 (48.6%).
Of course, this is hindsight bias. Imagine if, 5 years ago, someone had proposed to always fade the public on the NFL. I would have thought it was a bad idea. Wouldn't you?
Other spread trends
The public tends to favor the away team, taking it in 724/1340 games (59% of the time).
They also generally take the favorite on the spread. They took the favorite in 877/1340 games (64.5% of the time).
Both of those trends were true for NBA basketball as well. Gamblers seem to love their away favorites. When there's an away favorite, they take it 78% of the time (415/535 games). When there's an away underdog, they take it 54% of the time (448/824 games).
Chunky spreads
Some final scores in football are more likely than others. Scorigami, yadda yadda.
That means point differentials are going to have differing degrees of likelihood. A final score difference of 3 is going to be more likely than 5, because scoring a field goal to win a tie game is more likely than the long sequence of actions that would lead to a 5 point differential. (For example, one team might be up by 8 and the other team scores a field goal.)
The spreads are an estimate of the mean outcome of every game, not a guess at the final outcome. So they'll be less widely dispersed, but they should have roughly the same shape. For more detail, see the section "What would perfect lines even look like?" here.
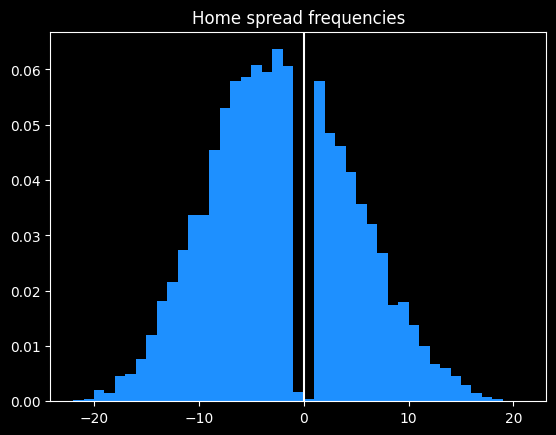
Here are NBA point spreads. Except for a bit of weirdness in the center due to NBA not having ties, and winning/losing by one point being rare for basketball reasons, it's a nice smooth curve:
Here's what spreads for the NFL look like. The lack of data isn't helping, but the overall shape clearly isn't a nice smooth curve. The spikes are much higher for certain numbers.
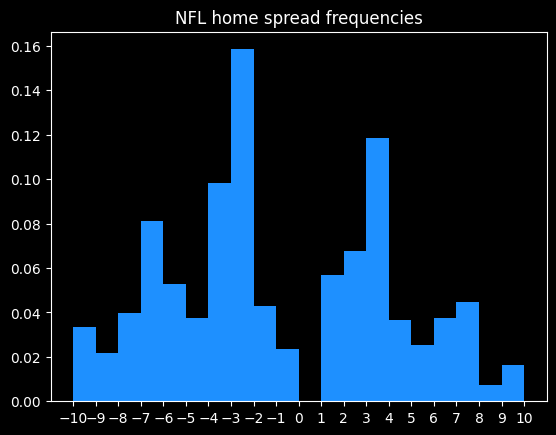
Here are the most common home spreads. These represent 73% of all NFL spreads.
|   spread |   count |   cumulative % |
|---------:|--------:|---------------:|
|     -3   |     109 |              8 |
|      3   |      90 |             15 |
|     -3.5 |      89 |             21 |
|     -2.5 |      86 |             28 |
|      2.5 |      64 |             32 |
|      3.5 |      56 |             36 |
|     -6.5 |      51 |             40 |
|     -7   |      49 |             44 |
|     -1.5 |      40 |             47 |
|      1.5 |      38 |             49 |
|     -7.5 |      37 |             52 |
|     -5.5 |      37 |             55 |
|     -4.5 |      37 |             58 |
|      7   |      35 |             60 |
|     -4   |      32 |             63 |
|      1   |      32 |             65 |
|     -1   |      28 |             67 |
|     -6   |      28 |             69 |
|      6.5 |      27 |             71 |
|      5.5 |      27 |             73 |
NFL betting is a game of 3's. 36% of lines are around +3 or -3. It's unusual to see lines that are greater than 7 or less than -7.5.
Actual point differentials
What about the differentials of actual games? I had to pull scores from another datasource, since the yahoo API only provides gambling data. I'm using the score data from pro-football-reference.com.
Here are spreads and final score differentials laid on top of each other. The orange part is where they overlap. The score differentials are much more dispersed, but they both show similar spikes at certain numbers:
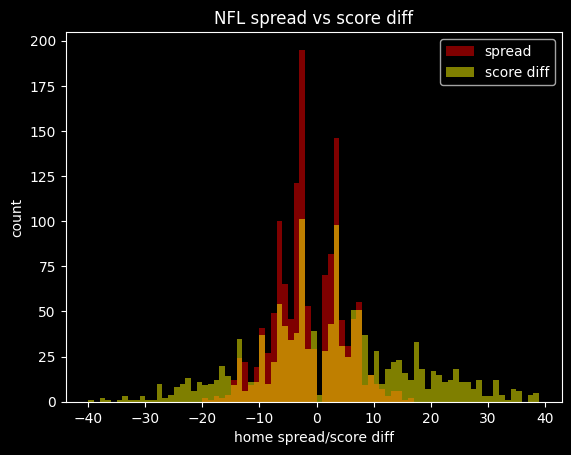
The spikes at the 3's and 7's are a bit more legible if I zoom in:
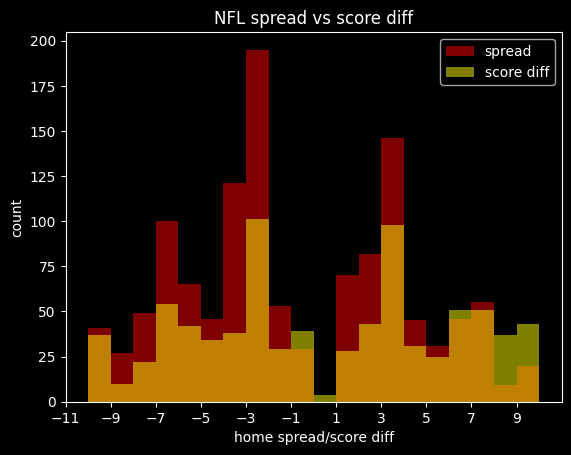
Here are the most common final score differentials for the away team -- which would be the seemingly ideal point spreads for the home team.
|   away_score_diff |   count |
|------------------:|--------:|
|                 3 |     101 |
|                -3 |      98 |
|                 7 |      54 |
|                -6 |      51 |
|                -7 |      51 |
|                -2 |      43 |
|                 6 |      42 |
|                 1 |      39 |
|                 4 |      38 |
|                10 |      37 |
|                -8 |      37 |
|                14 |      35 |
|                 5 |      34 |
|               -17 |      33 |
|                -4 |      31 |
Lots of the games end on 3's, 7's and 6's, just like the lines. Unlike the lines, none of them land on the half point.
The average outcome in the NFL is the home team winning by 2 points, so that's a decent estimate of home field advantage.
About half of all NFL games are within 8 points (a touchdown and a 2 point conversion) of the average outcome.
count    1359.000000
mean        2.062546
std        14.187563
min       -40.000000
25%        -6.000000
50%         2.000000
75%        10.000000
max        50.000000
Name: home_score_diff, dtype: float64
What do errors against the spread look like?
Let's compare the final point differential to the spread. The spread should be an unbiased estimate of the mean outcome between the two teams. We only get one data point to judge the quality of the line's estimate of the mean, which is sort of unfair, but that's just how it works with sports betting. I'll refer to the difference between the point differential and the spread as the error.
As I talked about in "Last fair deal in the country", because the line makers aren't trying to predict the actual outcome, merely the average outcome, some large errors are inevitable. The line makers can't actually predict the future, and aren't really trying to.
For example, the Miami Dolphins once beat the Broncos 70 to 20. The spread on the game was Dolphins -6, meaning it was off by 44 points relative to the final score. That doesn't mean the line really should have been Dolphins -50, though. It's hard to believe that if the game were played over and over again, the Dolphins would win by an average of 50 points, which is what a 50 point line signifies.
So we need to look at the errors as a whole rather than individual games to decide whether the line makers are good at their jobs or not. If the spreads are fair, the average error should be zero, and the errors should be fairly symmetrically distributed -- there should be about as many games where the error is -7 as it is +7, for instance.
Here's what the errors look like. The median is exactly zero, so kudos to the sportsbooks for that one. The right side is where the home team outperformed the spread, and the left is where they underperformed. There are a few more blowouts against the spread (more than 20 points) for the home team than the away team, but otherwise it's reasonably symmetrical.
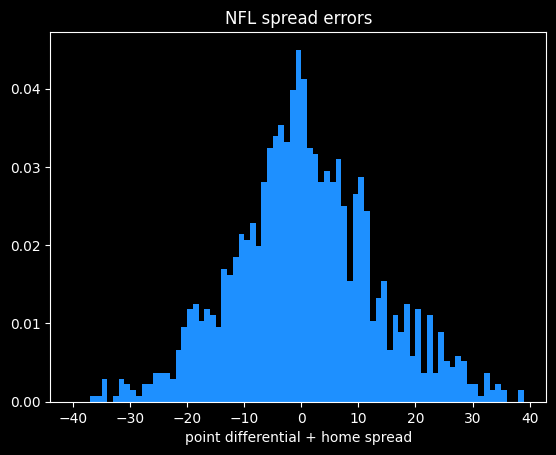
count    1358.000000
mean        0.437040
std        12.628641
min       -37.000000
25%        -7.375000
50%         0.000000
75%         8.500000
max        44.000000
Name: spread_error, dtype: float64
Next week: much more on NFL betting.
Mathletix Bajillion, playoffs round one edition
Both teams had wicked regressions to the mean this week.
I'll finish the season out, but I'm tempted to quit, because I think I've proved my point about line shopping: both teams are essentially earning a free bet every 30 or so bets by using betting exchanges rather than retail sportsbooks.
Both teams ended up making similar picks, because there are only 6 games to choose from.
Lines taken Wednesday morning
The Neil McAul-Stars
last week: 1-4, -330
Overall: 22-22-1, -85
line shopping: +135
- CAR +10.5 +100 (lowvig)
- CHI +1.5 -109 (prophetx)
- JAX +1 -107 (lowvig)
- PIT +3 -105 (lowvig)
- SF +5 -107 (prophetx)
The Vincent Hand-Eggs
last week: 5-0, +500
Overall: 20-22-3, -287
line shopping: +133
- CAR +10.5 +100 (lowvig)
- NE -3.5 -109 (prophetx)
- BUF -1 +101 (prophetx)
- SF +5 -107 (prophetx)
- CHI +1.5 -109 (prophetx)
Dec 23, 2025

Song: Light-Space Modulator, "These Things"
Notebook: https://github.com/csdurfee/csdurfee.github.io/blob/main/notebooks/super-contest.ipynb
Even the experts can't do it
As I've been chronicling in the "Bajillion" segment, experts are really bad at betting on NFL football, or at least the ones at the Ringer are.
That inspired me to make my first YouTube video, about sports gambling and why it's not really a game of skill. I'm still working on it, but I promised I'd do a thing a week on here. This is that thing.
The Ringer's football/gambling experts doing worse than a coin flip on the NFL could just be coincidence, bad luck, or as gamblers say, a bad beat. I figured I should make more of an effort to find real-world betting records on the NFL by people who have might skill as gamblers, rather than people who talk about sports for a living.
The Westgate Resorts (TM) Las Vegas Super Contest (R) seemed like the perfect testing ground. It's exactly like the Ringer 107, except there's cash on the line. With a buy-in of $1500 and around 1,000 teams a year, that's a pretty nice top prize. (There are fewer contestants this year than normal, maybe because the buy-in increased from $1,000.)
While the people at the Ringer are using their picks to generate interesting football content, these contestants have lot of financial incentive to do well and nobody they have to explain their picks to. The Ringer writers might have a bias against taking the uglier/harder to justify side of a bet, because their job is really to tell a story that people want to listen to. But these folks should be eating W's like crab legs and not caring how messy it looks.
That $1500 buy in is 207 hours of wages, pre-tax, for someone making the federal minimum wage. For regular folks, $1500 is most of a mortgage payment, or a few months of groceries. Anyone risking that much money should have rational reasons to believe they're good at betting on football, right?
This isn't a non-gambling football writer forced to make picks for the sake of content. The contestants consider themselves sharp enough to beat 1,000 other competitors in a pretty famous betting contest, for a Million dollar payout and the chance to get their photo taken with a bunch of showgirls while holding a giant novelty check.
This is the kumite of football betting, the ultimate contest of warriors, and I assume you're only going to enter the kumite if you've won a few fights before.
Mind you, there are around 15 NFL games every week and the teams only have to pick 5 of them for the Super Contest. Maybe most lines are so fair nobody can make money betting them, but the contestants only need to take one game in three. If there are any lines that are beatable, these contestants should be finding them. Their win rate should be an overly optimistic estimate of how beatable the average NFL line is, because they're not taking every game, or random games.
My assumption before running the numbers was that this was a contest for people who should have a decent chance of at least breaking even (over 52.4% winning percentage.)
The terrible, horrible, no good, very bad year
That assumption hasn't been even close to true this season. Data as of week 16 taken from the Westgate Resorts website.
There are 751 entrants in the 2025 contest. 59% of them (444/751) have a losing record. 76% of them would be losing money, if they were taking their picks at -110 odds.
Collectively, the teams have won 48.6% of their bets. It might not sound terrible, but there are 700+ teams who have taken 70 bets apiece, so it's a big sample size overall -- over 54,000 bets in total. Statistically, they're much worse than flipping a coin. If you flipped a coin 54,000 times and it came up heads 48.6% of the time, you'd be safe concluding it wasn't actually a fair coin.
Here's one way to visualize the suckitude. I simulated each team making picks by flipping a fair coin, and compared them to the actual results.
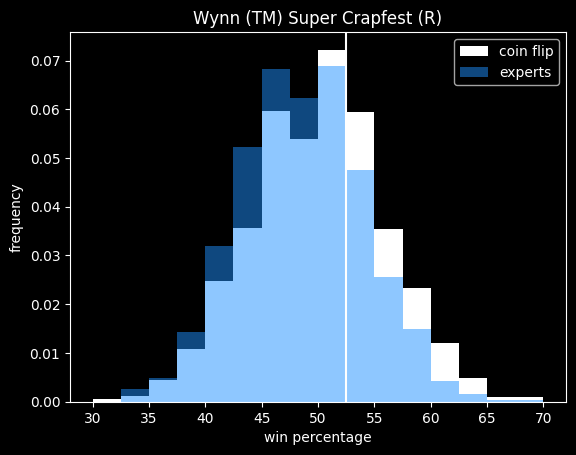
The white areas are where there were fewer real competitors than we'd expect by random chance, the dark blue parts are where there are more real competitors than expected, and the light blue is the overlap.
The white vertical line is the minimum winning percent to break even at standard -110 odds. Most of the white area, where there are fewer competitors than expected, is to the right of the line, and all of the dark blue area is at less than 50% winning percentage.
Anti Skill and Uncle Juice
The best entry in the contest is sitting at 53-21, the amusingly named BIFFS ALMANAC. That record would be an outlier if we were selecting bets by chance, so even though it's a small sample size, kudos to them, and their mostly accurate sports almanac.
The worst record belongs to the also amusingly named THISSHOULDBEEASY, with a record of 24-49. If that team had just taken the opposite of their bets, they'd be in 2nd place!
Most of the teams would be doing better if they wrote down their best picks, then took the opposite of them. Knowing stuff sure seems to be a disadvantage when betting on football.
In aggregate, whatever strategies or football knowledge or divination rites (*) the contestants are using makes them worse at picking winners -- they possibly have anti-skill. This is sort of what the efficient market hypothesis predicts -- picking stocks randomly (or index funds, which invest in every stock on the market) will generally outperform mutual funds that have professional fund managers making the picks.
(*) I'm a big tyromancy guy myself. RIP to the recently departed Claude Lecouteux, a legendary historian of spooky medieval stuff. If you ever need to write a heavy metal concept album on short notice, his books are a goldmine.
Previous years
After a bunch of wasted work to screen-scrape results from previous years off 3rd party sites, I discovered another website that has the complete records going back to 2013 in CSV format. Score!
This season has been particularly difficult on Super Contest gamblers, which probably explains the Ringer's poor record. Previous seasons have looked more like what I expected -- the average Super Contest entrant is a little better than flipping a coin, but not good enough to actually make money gambling.
Here are the Expected Values by year:
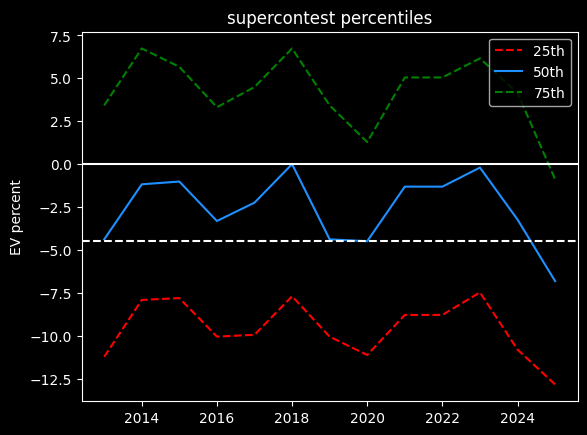
The dotted line is at -4.5%, the Expected Value (EV) of taking a bet at -110 with a 50% chance of winning. There have been 5 seasons where the average competitor has done about the same as flipping a coin, or worse, and 2 seasons where they came close to breaking even.
Over all seasons and all contestants, the average EV is -2.5%, about the same as betting 'reduced juice' (-105 odds instead of -110) with a 50% chance of winning. Overall, the EV has been better than what we'd expect by chance, but not good enough to be profitable.
Since the contestants only have to pick 5 games every week, this data should represent the best case scenario -- the most beatable lines possible, being taken by more experienced than average gamblers -- and they're still losing money 11/13 years, and breaking even the other two.
While the 75th percentile has a decent rate of return (up until this season), that's true of flipping a coin as well. With fewer than 100 bets in a Super Contest season, it's very possible to have a winning record by chance alone.
The win rate of competitors has been going down for 3 years in a row. It may be due to weaker competition in the Super Contest, or just random variation, but I would guess it's at least partially due to better lines. More money than ever is being gambled, and there's more information than ever, so the lines should get tighter. I would have to pull a lot more data to answer that question, though.
Looking for other experts
OK, maybe that's still not enough proof -- what about people who make a living selling their supposed gambling expertise? I've looked at a ton of sites that sell picks for money, so I have an idea how this will go. But I came across a new one that's run by some pretty smart folks, so let's give it a crack, and I'll try to act suprised at the results.
The site in question is called FTN Fantasy. It's affiliated with Aaron Schatz, who I'm pretty sure basically invented modern football analytics with his site Football Outsiders.
DVOA, ever heard of it?
If football betting is a game of skill, a game of ball-knowing (at least the stats version of ball-knowing), he should have that skill. Here's Aaron's record:
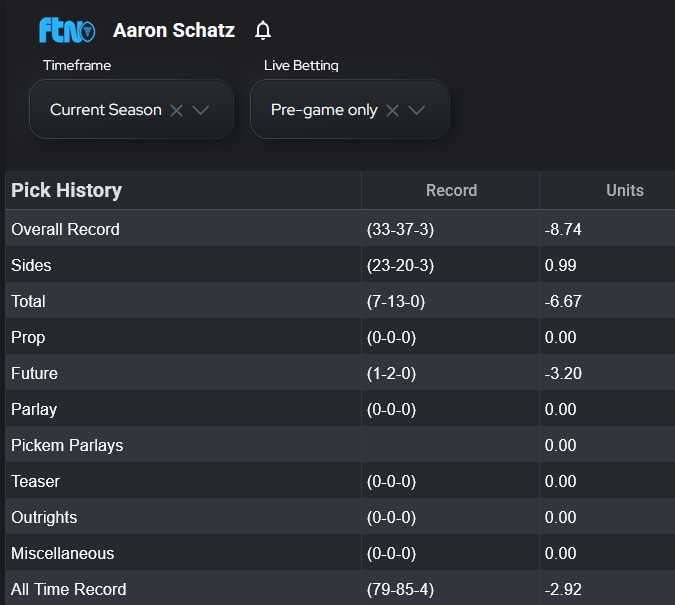
Oh no! He's got a losing record overall, a -11% EV on his bets (vs. -4.5% for picking which mascot would win in a fight). Who could have seen that coming?
Here's the whole site's record:
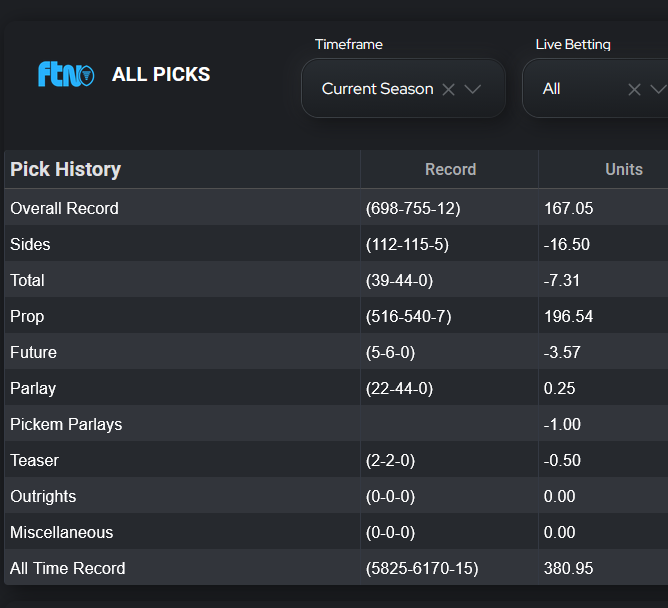
While they have a winning record overall, they have a losing record against the spread (the bets labeled Sides).
Giving them props
Prop bets are, well, propping their record up. Since the site is primarily about fantasy football, it makes sense they would be strong on prop bets, since fantasy is all about individual player predictions. That makes them a cut above most tout sites, who aren't good at anything.
It's quite possible that prop bets are beatable in a way spread bets aren't, though as discussed in the video, the big sportsbooks no longer allow taking the unders on prop bets, which I'm sure makes it harder to find value.
My caveat about tips on prop bets is that the lines tend to move very rapidly, and in large amounts. A line could very quickly go from positive to negative Expected Value before someone could get a bet down. So the tips might be legit, but not be usable to the gambler paying for them -- they have a very short shelf life.
Touts and their tricks
The only tout with a good record against the spread is esteemed actor Michael Chiklis apparently doing a little moonlighting:
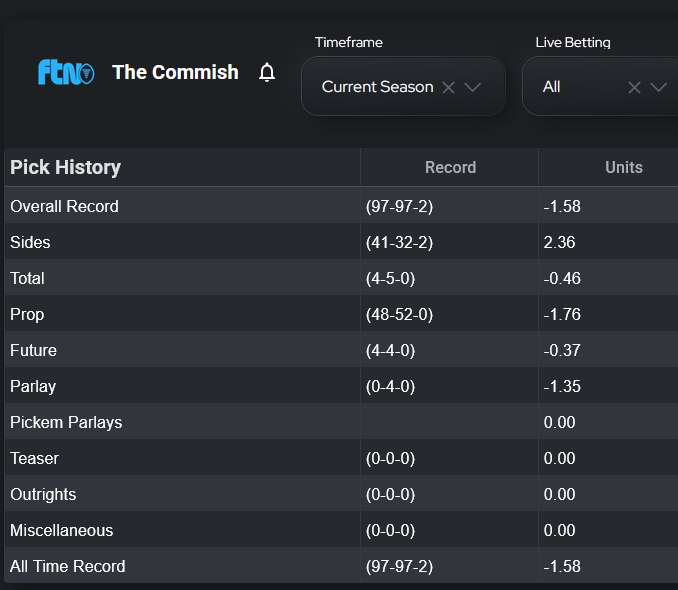
The Commish is doing something I've seen a lot of touts do, which is taking some games at higher than -110 odds in order to make the win-loss record appear better (for example, buying a couple of points and taking -150 odds, which should win significantly more than 50% of the time). The equivalent record at -110 odds would be 41-35, only a 54% winning percentage. That's better than nothin', but it ain't much.
I'm inclined to be distrustful of any tout pulling that trick, since buying points is a negative Expected Value play. (We don't need math for this one: the sportsbooks wouldn't offer the option of buying points if it was positive EV for the gambler. They're counting on the gambler making an emotional decision to buy the points, because they've done the math and know it's a bad deal.) Buying points might make the record look better, but it will hurt profits/increase losses over the long run.
Bajillion, Week bajillion
One mathletix team picks bets randomly, the other algorithmically.
The Ringer had another losing week, going 12-13 overall, despite one team going 5-0. Mathletix went 6-3 on the week, despite a couple of bad beats (bets that just barely lost).
Lines taken on Tuesday morning.
The Neil McAul-Stars
last week: 4-1, +295
Overall: 20-15, +454
line shopping: +104
- WAS +7 -104 (lowvig)
- MIN +7 +103 (prophetx)
- GB -2.5 -112 (lowvig)
- TEN +2.5 +102 (prophetx)
- JAX -6.5 -106 (prophetx)
The Vincent Hand-Eggs
last week: 2-2-1, -6
Overall: 13-20-2, -787
line shopping: +113
- PIT -3.5 +103 (prophetx)
- HOU +2.5 -108 (prophetx)
- WAS +7 -104 (lowvig)
- ARI +7 -101 (prophetx)
- BAL +2.5 +101 (lowvig)
Nov 14, 2025

Song: Scientist, "Plague of Zombies"
This is a departure from the usual content on here, in that there's no real math or analysis. There's also not much of an audience for this website yet, so I hope you'll indulge me this week.
I was curious what all these gambling shows talk about for hours, when the picks they produce collectively appear to be no better than randomly chosen. I'm always interested in how people make decisions. How does their process work for choosing what bets to take? How might it work better?
Before I get too far into this, I know I'm being a killjoy. These podcasts are for entertainment purposes, just like betting is entertainment for a lot of people, not a sincere attempt to make money over the long term. Some degenerate gambling behavior is part of the appeal of these podcasts. They're selling the idea that "gambling is fun" as much as any particular bets.
It's still weird to be a gambling expert who can't do better than a coin flip.
I previously showed how combining multiple machine learning algorithms thru voting will only improve results when they make independent mistakes, and are significantly better than guessing. Those are both pretty intuitive conditions, and I think they're true of groups of people as well. If everybody has the same opinion, or makes the same sort of mistakes, or nobody really knows anything, there can't be a wisdom of crowds.
Humans have a big advantage over combining machine learning algorithms. We can talk with each other, challenge each others' assumptions, provide counterexamples, and so on.
There's not a ton of that in the gambling podcasts I listened to. Gambling talk is all about inventing stories about the future. It's sort of a competition for who can pitch the best narrative for the game. These stories are almost their own literary genre, and the construction of these are more important than the picks themselves. There aren't a lot of opportunities for the wisdom of crowds or some sort of error correction to occur.
Imagine I had a magic black box that was right about NBA lines 56% of the time. I could sell those picks, and be one of the better handicappers on the internet. While I could certainly write a little story for each one, maybe in the style of Raymond Carver -- "Will You Please Take The Over, Please?" -- the story doesn't make the bet more likely to be true, though, right? A factual story would be the same for every bet, and not very interesting: "there is slightly more value on this side of the bet, according to the model."
What we talk about when we talk about sports betting
Gambling personalities are always talking about what has happened in the past -- connections to previous games they've bet on, dubious historical trends, and the tendencies of certain players. Interactions like, "I thought you had a rule never to bet against Baker Mayfield?" "But he's 2-7 on the road in early Sunday games after a Monday night game where he got over 30 rushing yards."
These arbitrary connections remind me of a bit from Calvino's Invisible Cities:
In Ersilia, to establish the relationships that sustain the city's life, the inhabitants stretch strings from the corners of the houses, white or black or gray or black-and-white according to whether they mark a relationship of blood, of trade, authority, agency. When the strings become so numerous that you can no longer pass among them, the inhabitants leave: the houses are dismantled; only the strings and their supports remain.
There were quite a few of those useless strings in the November 6th episode of the Ringer Gambling Show.
The top bun
On a couple of occasions, the show discussed whether certain information was already priced into the line or not. Since gambling should be about determining which bets have positive expected value, that's a very useful thing to discuss. "If this spread looks wrong, what does the market know that we don't? Or what do we know that the market doesn't?"
If the goal is to win, the implicit question should always be: why do we think we have an advantage over other gamblers taking the other side? Why are we special? Why do we think the line isn't perfect?
Superstitions and biases
They were resistant to bet on teams that they had recently lost money on -- not wanting to get burned again. This is clearly not a financial choice, but an emotional one. The axe forgets, the tree remembers.
Team loyalty also affected their betting decisions. They avoided taking Baltimore because Ariel is a Ravens fan (the bet would have won). Jon suggested betting against his team, the Dolphins, which Ariel jokingly called "an emotional hedge". The Dolphins won. So they cost themselves two potential wins due to their fandom.
They decided not to take a bet on Houston (which ended up winning) because, in Jon's words, "betting on Davis Mills is not a pleasant experience". Whether a team or player was fun to bet on came up a couple of other times as well. Someone just trying to make a profit wouldn't care how fun the games are to watch. They might not even watch the games at all. Whether the gambler watches the game or not has no influence on the outcome.
Bets need to be fun, not just a good value. These gambling experts still want to experience "the sweat" -- watching the game and rooting for their bet to win. As I wrote last week, betting on the Browns and losing is like losing twice, so even if the Browns are a better value, they are a bad pick for emotional reasons. Who wants to have to be a Browns fan, if only for a few hours?
It's sort of like Levi-Strauss said about food. It's not enough that a type of food is good to eat, it must also be good to think about. The Houston Texans led by Davis Mills are not "bon à penser".
Not enough useful disagreement
All three of the bets they were in total agreement on (PIT, TB, ARI) lost. Nobody presented a case against those bets, so there was no opportunity for any of them to change their minds or reconsider their beliefs.
I'm not endorsing pointless contrarianism -- not every side needs to be argued. Don't be that one guy in every intro to philosophy class. But if both sides of an issue (or a bet) have roughly equal chances of being true, there should be a compelling case to be made for either side. Someone who can't make both cases fairly convincingly probably doesn't know enough to say which case is stronger.
Two types of hot streaks
For gamblers, there's one type of hot streak that's always bound to end. A team has won a few games it shouldn't have won, therefore they're bound to lose the next one. Their lucky streak will fail. In the real world, there's no invisible hand that pulls things down to their averages on a set schedule. In a small sample size of 17 games in an NFL season, there's no reason to think things will be fair by the end, much less the very next game. Now, a team could be overvalued by the market because they got some lucky wins, which makes them a value to bet against. But teams don't have some fixed number of "lucky games" every year, and once they've burned through those, their luck has to turn.
The other type of hot streak is bound to keep going. The team were divided whether to bet the Rams or not. They decided to go with Ariel's opinion, because she's been on a hot streak lately. If Ariel's record was demonstrably better than the other two hosts' over a long period of time, it would make sense deferring to her as the tiebreaker. But winning a few bets in a row doesn't mean the next bet is any more likely (or less likely) to win. As a teammate, that's a supportive thing to do, so I'm sure that's part of it. But people who gamble tend to think they have it sometimes, and don't have it other times. Sometimes they're hot, sometimes they're cold.
We've seen this before with NBA basketball. Basketball players have an innate tendency to believe in the hot hand, even though it doesn't exist, so much so that it actually hurts their performance.
Why would the hot hand exist when it comes to predicting the future? What laws of physics would allow someone to predict the future better at some times rather than others? A gambler, regardless of skill level, will occasionally have hot streaks or cold streaks based on chance alone. So a gambler on a hot streak shouldn't change what type of bets they take, or how much they wager, just like NBA players shouldn't change what type of shots they take. But they do.
The problem with props
They suggested a bunch of prop bets. 5 of the 6 suggested were overs -- bets on players scoring at least one touchdown, or going over a certain number of yards. 4 out of 5 of the overs lost.
Gamblers greatly prefer betting the over on prop bets, which creates a problem. There's little to no money wagered on the under, which means gamblers taking the over are betting against the house, not other gamblers. That should be a warning sign. Sportsbooks are rational economic engines. If they're taking on more risk in the form of one-sided bets, they're going to want more reward in the form of a higher profit margin.
For a lot of prop bets, the big sportsbooks don't even allow taking the under. If a gambler can bet both sides, at least we can calculate the overround, or profit margin on the bet. With one-sided bets like these, there's no way to know how juiced the lines are (my guess would be to Buster Bluth levels.)

Traditionally, a sportsbook wants to have equal action on both sides of a bet. They don't really care what the line is. As long as the money's basically even (they have made a book), they can expect to make money no matter which team comes out on top.
With these one sided prop bets, there's no way for the free market to move the price by people betting the under instead. So the line doesn't need to be that close to the actual odds. Without action on both sides, sportsbooks have to be extremely vigilant about never setting an inaccurate line that gives the over too much of a chance of winning. And I don't think that gamblers taking overs on prop bets are too price sensitive. So the sportsbooks have multiple reasons to make the overs a bad deal.
Even sportsbooks that offer unders charge a huge amount of vig on prop bets to offset the additional uncertainty to the sportsbook. There are so many prop bets on each game relative to the number of people who take them. They can get away with setting the lines algorithmically because the lines don't need to be all that accurate with a bunch of extra juice on top.
This screenshot is from an offshore "reduced juice" sportsboook that allows bets on the unders.
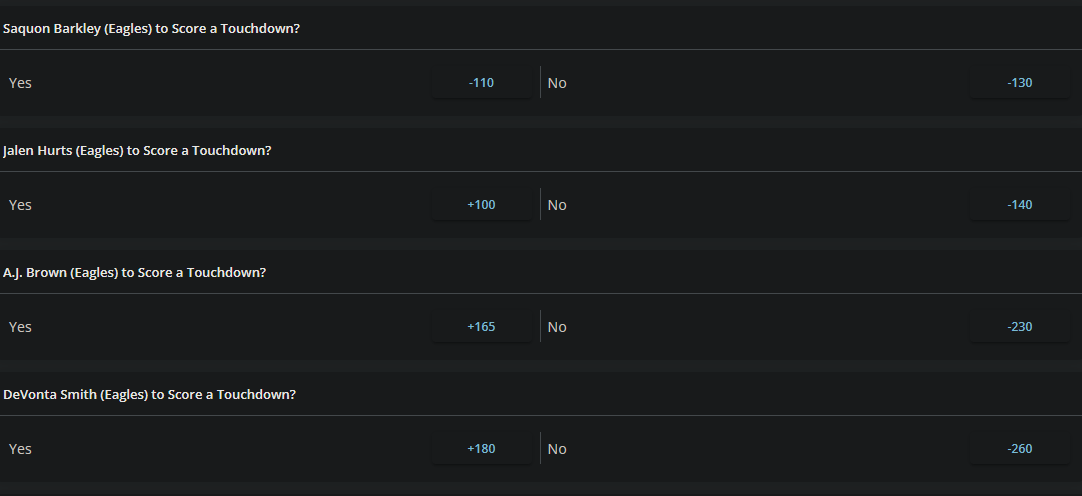
We can convert the lines to win probabilities and add them up to calculate the overround, as covered a couple of articles ago.
For the Saquon Barkley bet, the overround is 8.9%. For Hurts it's 8.3%, for Brown it's 7.4%, and 7.9% for Smith.
The overround for a normal spread bet is 4.5%. We saw it's about the same with NBA money lines. Because this book is reduced juice, overrounds on spread bets are around 2.6% -- for instance odds of -108/-102 or -105/-105 instead of -110/-110.
Prop bets have 2x the juice of a traditional spread bet, and over 3x reduced juice. That requires the gambler to win far more often just to break even.
Ways to potentially reduce bias
I've previously written about an experiment that showed gamblers tend to take the favorite, even when they've been told it's a worse bet than the underdog. That wasn't true of the Ringer teams last week. They only took 11 favorites out of 25, so they didn't show that particular bias. But I think the experiment gives a hint how to reduce bias in general.
The researchers found that people could be corrected of their bias towards favorites by writing out what they thought the lines should be before seeing what the lines were. It causes the person to actually try and do the math problem of whether the bet is a good investment or not, rather than anchoring on the price set by the market, and picking the better team, or the conventional wisdom.
It would be interesting to try having each team member decide what the fair line was, then average them out. Do predictions made that way perform better?
Similarly, it would be helpful to convert any odds from the American style (like +310, or -160) to the equivalent probability. People who have gambled a lot might have an intuitive sense of what -160 means, but for me, the equivalent 61.5%, or "about 5/8" is much clearer. I can imagine a large pizza missing 3 of the 8 slices.
Betting jargon and betting superstitions should be avoided. Does each bet make sense as a financial transaction? Personal feelings and the enjoyability of the bet shouldn't factor in. The quality of the game and who is playing in it shouldn't matter.
The bottom bun
Despite not being a gambler, the gambling podcasts I listened to were fairly enjoyable. It's basically Buddies Talk About Sports, which is a pleasant enough thing to have on in the background. Nobody would listen to Casey's Rational Betting Show, for multiple reasons.
The Mathletix Bajillion, week 2
The Ringer crew had a good week, collectively going 14-11 (56%). One team out of five is now in the green. mathletix still won the week, winning 60% of our bets.
As a reminder, one set of picks is generated algorithmically, the other randomly. I'll reveal which one at the end of the competition.
"line shopping" refers to how much money was saved, or extra money was gained, by taking the best odds available instead of betting at a retail sportsbook.
All lines as of Friday morning.
The Neil McAul-Stars
last week: 5-0, +504
line shopping: +4
- LAC -3 +100 (prophetX)
- TB +5.5 +100 (lowvig)
- MIN -3 +105 (lowvig)
- ARI +3 -101 (prophetX)
- SEA +3.5 -111 (prophetX)
The Vincent Hand-eggs
last week: 1-4, -334
line shopping: +6
- LAR -3 -110 (hard rock)
- SF -3 -101 (prophetX)
- DET +2.5 +100 (lowvig)
- TEN +6 -107 (prophetX)
- GB -7 -105 (prophetX)
Nov 07, 2025
Song: Charlie Musselwhite, "Cristo Redentor"
Are betting experts any good at what they do?
These days, nearly all talk about gambling I see on TV and the internet is sponsored by one of the sportsbooks. How good is all this sponsored advice?
There are quite a few shows that are just about gambling, but more common are ad reads from Youtubers or sportscasters who are sponsored by sportsbooks, but aren't really focused on gambling. These appear on-air in the middle of a game, or an ad break in a Youtube video.
Picks from sports announcers do terribly, as the Youtube channel Foolish Baseball has documented in their wonderful video, Baseball is Ruining Gambling.
As a numbers guy, it's baffling that anybody would follow these obviously sponsored picks at obviously juiced lines, given by obviously casual gamblers, but some people are taking them, because the sportsbooks keep paying for the ads.
Gambling is a social and parasocial activity now, another thing you do on your phone when you're bored that sort of feels like interacting with other humans, but isn't.
Some gamblers want to be on the same side of the bet as their favorite YouTuber, who give their favorite picks as a part of an ad read. The apps also allow you to follow people, and take the same bets they take. It's yet another one-way online relationship.
Other gamblers take bets to feel more connected to their team. Announcer parlays are invitations to take a financial interest in the game that you're already watching, not necessarily because you think the Brewers play-by-play guy is secretly a betting wizard. The baseball announcers don't seem to have much of an interest in gambling, or being touts. They're not there for our wholesome national pastime, gambling on sports, they're true sickos who are only interested the disreputable game of baseball. Putting together some half-ass parlay for the promo is part of their job. It's just another ad read. It may as well be a local roofing company or a personal injury lawyer.
Sportsbooks advertise because it makes them money in the long run. These companies seem pretty well-run, if nothing else. They want to sponsor people who are good at bringing in customers with a high Customer Lifetime Value -- people who will lose over and over again for years, making back the cost to acquire them as a customer many times over. That's it. That's the game. Why would they sponsor people who give good advice about gambling, or good picks?
Do people care whether gambling experts are actually good or not?
Some guys talk about gambling for a living. They discuss sports from the perspective of people who are gamblers first, and sports fans second. Everything's an angle, or a trend, or a bad beat. At the extreme, athletic competitions are interesting because betting on them is interesting, not because sports themselves are. These guys are both living and selling the gambling lifestyle, which I talk much more about in the book:
A parasocial relationship with a guy selling picks or talking about gambling on a podcast causes guys to want to form social relationships around gambling. They're Gambling Guys now. Which leads to an endless parade of dudes complaining about their parlays online, and, I would wager, annoying the heck out of their significant others. "It's a whole lifestyle, Sherri! Of course I had to get my tips frosted! I'm a Gambling Guy now!"
It's all imaginary. An imaginary relationship with a betting guru in the form of a "hot tip". An imaginary relationship with the sporting event or player in the form of a bet. An imaginary relationship with reality itself in the form of the rationalization about why the "hot tip" didn't win. An imaginary relationship between winning and skill.
Being a sports fan is already ridiculous enough.
Poking the bear, a bit
The Ringer is a website about sports and pop culture that has evolved into a podcasting empire. I like a lot of what they do, and I especially appreciate that they publish great writing that surely isn't profitable for the company. For the most part, I can just enjoy their non-gambling content and ignore that it's subsidized by gambling.
But they've done as much as anyone to normalize sports betting as a lifestyle, and deserve an examination of that. The Ringer wasn't worth a bajillion dollars before gambling legalization, back when they were doing MeUndies ad reads.
The Ringer has an incredible amount of content that's just Gambling Guys Talk Gambling with Other Gambling Guys, around 10 hours a week of podcasts, by my count. The Ringer's flagship show is the Bill Simmons Podcast, which usually devotes at least a couple hours a week to discussing which bets Bill and his pals think are good. (Previously satirized in Cool Parlay, Bro)
The site also has an hour long daily podcast about gambling, The Ringer Gambling Show, and several other podcasts that regularly discuss betting. As far as I know, all of their sports podcasts feature gambling ad reads, even the ones with hosts that clearly find gambling distasteful.
Several members of the Ringer's staff are full time Gambling Guys now. They talk about their addictions for a living, which must be nice. I've been talking about my crippling data science addiction on here for months without a single job offer.
Are these guys good at their job, though? (Are they good at their addictions?) The Ringer is currently having a contest betting on the NFL between five different NFL podcasts, four of which primarily cover sports gambling, which they're calling The Ringer 107. Here are their results through Week 9:
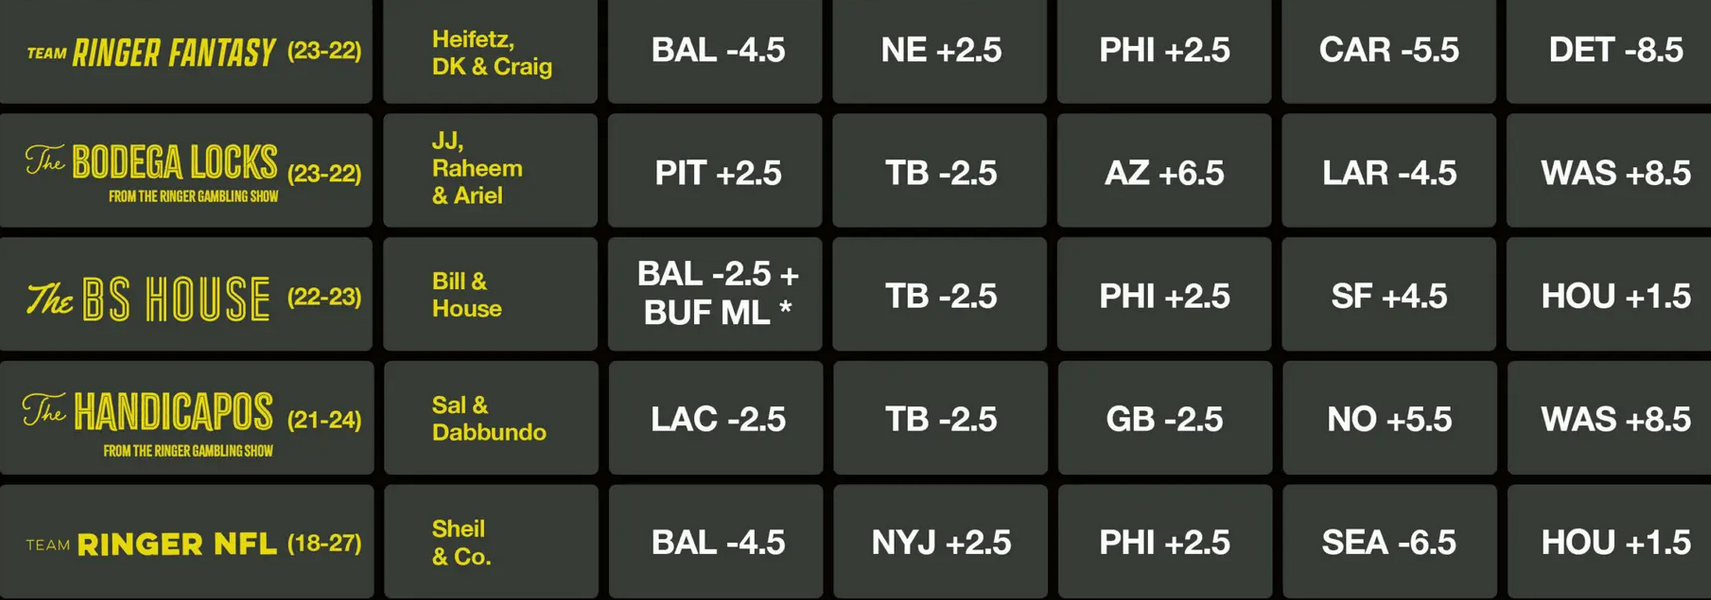
Every single one of the five teams is losing money against the spread. They don't make it clear on the website, but some bets are at -120 vig, so the records are even worse than they look.
It might be bad luck, right? I've written at length about how having a true skill level of 55% doesn't guarantee actually winning 55% of the bets.
Based on this data, it's extremely unlikely the gambling pros at the Ringer are just unlucky. I simulated 5 teams taking the same number of bets as the Ringer's contest so far. If every pick had a 55% chance of winning (representing picks by advantage players), then 99.5% of the time, at least one team does better than all five of the Ringer's did.
Even at a 50% winning rate, same as flipping a coin, the simulation does better than the Ringer 91% of the time. Based on this data, you'd be better off flipping a coin than listening to these gambling experts.
The easiest way to know they can't do it
If I talked about gambling for a living and was demonstrably good at it, I'd want everyone to see the proof. These guys almost never post their actual records over a long stretch of time, though. They will crow about their wins, and offer long-winded explanations as to why their losing picks were actually right, and reality was wrong. But it's hard to find actual win-loss records for them.
Last season, The Ringer's Anthony Dabbundo didn't appear to keep track of his record betting on the NFL against the spread at all (example article). This year, he has, so we know he's gone 37-37, and 20-25 on his best bets, despite some of them being at worse than -110 odds. His best bets have had a return of -16.7%, about the same as lazy MLB announcer parlays, and almost 4 times worse than taking bets by flipping a coin.
What odds would you give me that the Ringer goes back to not showing his record next season?
To be clear, I don't think Dabbundo is worse than the average gambling writer at gambling. I've never found a professional Gambling Guy that is statistically better than a coin flip. Dabbundo's job is writing/podcasting the little descriptions that go along with each of his picks. His job isn't being good at gambling, it's being good at talking about gambling. There is no evidence that he can predict the future but plenty of evidence he can crank out an hour of podcast content every weekday that enough people enjoy listening to. Predicting the future isn't really the value-add for these sorts of shows.
The curse of knowledge
I think it's significant that by far the worst team in the contest is the Ringer NFL Show, which is primarily not about gambling. It's a show by extreme football nerds, for extreme football nerds. Once in a while I listen to it while doing the dishes, and I'll go like 20 minutes without recognizing a single player or football term they're talking about. They are all walking football encyclopedias, as far as I'm concerned.
If gambling really were a matter of football-knowing, they should be winning. They aren't, because betting isn't a football-knowing contest.
I can see how being a true expert might make somebody worse at gambling. Every bet is a math problem, not a trivia question. A bet at a -4.5 spread might have a positive expected value, but a -5.5 spread have a negative expected value. People who are good at sports gambling can somehow tell the difference. Like life, sports gambling is a game of inches.
The folks on the Ringer NFL Show know the name of the backup Left Tackle for every team in the league, but I don't think that's really an advantage in knowing whether -4.5 or -5.5 is the right number for a particular game. Most of the cool football stuff they know should already be baked into the line, or is irrelevant. Sports betting is a lot more like The Price Is Right than it is like sports.
A great chef might know practically everything there is to know about food. They might know what type of cheese is the tastiest, how to cook with it, and so on. But if they went to the grocery store, that doesn't mean they would notice that they had gotten charged the wrong price for the cheese, or that they could get it 20% cheaper at another store. That's a totally different skillset and mindset.
People on these gambling shows spend several minutes explaining each of their picks, listing lots of seemingly good reasons. I think that having to give a good reason for each pick forces them into going with what they know, not considering that all the obvious information and most of the non-obvious information they have is already reflected in the line. Needing to be seen as an expert could lead them to pick the side with slightly less value on it, because they want to make a defensible pick. It's much better to have a good sounding reason for making a pick, and losing, than it is to have no reason for making a pick and winning.
In general, I think every bet has a more reasonable side and a crazier side. Anybody prognosticating for a living has a disincentive to pick the crazier side if they're going to have to explain the bet if they happen to lose. It doesn't if there was actually more value than the Browns. Losing on the Browns and then having to live with being the guy who bet on the Browns is two losses at once.
The Mathletix Bajillion, week 10
I figured I should take a crack at it. The season is mostly over, so it will be a small sample size, but let's see what happens. At the very least, it will force me to publish something at least once a week for the next couple of months, and if things go bad, work on developing the shamelessnesss of someone who gets paid to predict the future, even though they can't.
I'm going to make two sets of picks, one based on a proprietary betting model I created, the other purely random, based on rolling dice. At the end, I will reveal which team is which, and see how they do against the Ringer's teams.
I am an extremely casual fan of the NFL, so little to no actual ball-knowing will go into these picks. I probably know less about football than the average person who bets on football. I don't think that's really a disadvantage when the football experts are going 18-27 on the year.
I will take all bets at -110 odds or better. No cheeky -120 bets to goose the win-loss record a bit, like some of the teams in the Ringer competition have done. But I will also shop around between sportsbooks and take the best lines I can find, by checking sites like unabated, reduced juice sportsbooks like lowvig and pinnacle, and betting exchanges like matchbook and prophetx.
For the betting exchanges, I will only take spreads where there is at least $1000 in liquidity -- no sniping weird lines. Part of what I'm trying to show is that bargain shopping, which has nothing to do with football knowledge, can make a big difference. So I will shop pretty aggressively. Even if I lose, I will lose less fake money than I would at -110, which means I don't have to win as often to be profitable. I'm pretty confident I can beat the Ringer pros on that point at least.
Sources will be noted below.
Team names come from the 1995 crime drama Heat, starring Tom Sizemore, in accordance with the Ringer house style.
Picks were made Friday evening.
The Neil McAul-Stars
- ATL +6.5 -108 (fanduel)
- NO +5.5 -109 (prophetx)
- SEA -6.5 -110 (prophetx)
- PHI +2 -109 (Rivers)
- LAC -3 +104 (prophetx)
The Vincent Hand-eggs
- DET -7.5 -105 (prophetx)
- PIT +3 -109 (prophetx)
- TB -2.5 -110 (fanduel)
- CHI -4.5 -105 (fanduel)
- CAR -5 -110 (harp rock casino)
Jul 12, 2025
Earlier this year, I wrote most of a book about the psychology and mathematics of sports gambling called Your Parlay Sucks. The book never quite came together, and is probably too weird to ever get published, but it has some interesting bits, so I figured I'd share them here.
Why did I get interested enough in sports betting to write a whole book about it? I think it's because I'm fascinated by the limits of rationality. Philosophers, economists and social scientists would like to treat humans as though they are capable of making rational decisions. That conflicts with the real world, where even pretty smart people make irrational choices. I certainly have.
Sports betting is a sort of rationality lab. You and I might have different values or beliefs. What's crazy to me might be normal to you, or vice versa, but we should both be able to agree that placing bets that are guaranteed to lose money is irrational.
This paper, "Intuitive Biases in Choice versus Estimation", is a wonderful illustration of cognitive bias and irrationality in the realm of sports betting.
The researchers had people bet on NFL football against the point spread. If you're not familiar, the idea behind the point spread is to attract an equal amount of action on both sides of the bet by handicapping one of the teams. If you bet on the favorite, they need to win by at least the amount of the spread for the bet to win. The other side side wins if the team loses by less than the spread, or wins the game outright.
Gamblers can bet either side, and if there are more bets on one side than the other, the sportsbook can change the spread to attract equal action. So there's a potential for the wisdom of crowds to kick in, the invisible hand of the market moving the line towards the best estimate possible.
Of course, that depends on gamblers being rational. A rational gambler has to be willing to take either side of a bet (or not bet at all), depending on the spread. If the spread is biased towards the underdog, they should be willing to take the underdog. If it's biased towards the favorite, they should take the favorite. And if the line is perfectly fair, they shouldn't bet at all.
As I showed a while back with ensemble learning, the wisdom of crowds only works if the errors that people make are uncorrelated with each other. If most people are wrong about a particular thing, the "wisdom of crowds" will be wrong, too.
This study found that people are consistently irrational when it comes to point spreads. They will tend to bet the favorite, even though both sides should have an equal chance of winning. It's probably easier to focus on which team is better, and assume that the better team is more likely to win against the point spread as well. It's harder to imagine the underdog losing the game but winning the bet, or pulling an upset and winning outright.
The study took things further and adjusted the lines to be biased against the favorite team, so that taking the favorite would be guaranteed to lose more than 50% of the time. They even told the gamblers that they did this. And the gamblers still overwhelmingly picked the favorites. The researchers continued the study for the whole season. Even after weeks and weeks of steadily losing, being told over and over that the lines are unfair, the gamblers still preferred to take the favorites. They never learned. The participants got to keep their winnings, so they had an incentive to be right. And they still couldn't do it.
Sportsbooks have a lot of ways of trick people into taking extra bad bets, as I will show. But they don't really need to. People will consistently take bad bets even if they should know they're bad bets.
May 23, 2025
(the code used is available at https://github.com/csdurfee/nfl_combine_data/).
Intro
Every year, the National Football League hosts an event called the Combine, where teams can evaluate the top prospects before the upcoming draft.
Athletes are put through a series of physical and mental tests over the course of four days. There is a lot of talk of hand size, arm length, and whether a guy looks athletic enough when he's running with his shirt off. It's basically the world's most invasive job interview.
NFL teams have historically put a lot of stock in the results of the combine. A good showing at the combine can improve a player's career prospects, and a bad showing can significantly hurt them. For that reason, some players will opt out of attending the combine, but that can backfire as well.
I was curious about which events in the combine correlate most strongly with draft position. There are millions of dollars at stake. The first pick in the NFL draft gets a $43 Million dollar contract, the 33rd pick gets $9.6 Million, and the 97th pick gets $4.6 Million.
The main events of the combine are the 40 yard dash, vertical leap, bench press, broad jump, 3 cone drill and shuttle drill. The shuttle drill and the 3 cone drill are pretty similar -- a guy running between some cones as fast as possible. The other drills are what they sound like.
I'm taking the data from Pro Football Reference. Example page: https://www.pro-football-reference.com/draft/2010-combine.htm. I'm only looking at players who got drafted.
Position Profiles
It makes no sense to compare a cornerback's bench press numbers to a defensive lineman's. There are vast differences in the job requirements. A player in the combine is competing against other players at the same position.
The graph shows a position's performance on each exercise relative to all players. The color indicates how the position as a whole compares to the league as a whole. You can change the selected position with the dropdown.
Cornerbacks are exceptional on the 40 yard dash and shuttle drills compared to NFL athletes as a whole, whereas defensive linemen are outliers when it comes high bench press numbers, and below average at every other event. Tight Ends and Linebackers are near the middle in every single event, which makes sense because both positions need to be strong enough to deal with the strong guys, and fast enough to deal with the fast guys.
Importance of Events by Position
I analyzed how a player's performance relative to others at their position correlates with draft rank. Pro-Football-Reference has combine data going back to 2000. I have split the data up into 2000-2014 and 2015-2025 to look at how things have changed.
For each position, the exercises are ranked from most to least important. The tooltip gives the exact r^2 value.
Here are the results up to 2014:
Here are the last 10 years:
Some things I notice:
The main combine events matter that much either way for offensive and defensive linemen. That's held true for 25 years.
The shuttle and 3 cone drill have gone up significantly in importance for tight ends.
Broad jump and 40 yard dash are important for just about every position. However, the importance of the 40 yard dash time has gone down quite a bit for running backs.
As a fan, it used to be a huge deal when a running back posted an exceptional 40 yard time. It seemed Chris Johnson's legendary 4.24 40 yard time was referenced every year. But I remember there being lot of guys who got drafted in the 2000's primarily based on speed who turned out to not be very good.
The bench press is probably the least important exercise across the board. There's almost no correlation between performance and draft order, for every position. Offensive and defensive linemen basically bench press each other for 60 minutes straight; for everybody else, that sort of strength is less relevant. Here's one of the greatest guys at throwing the football in human history, Tom Brady:
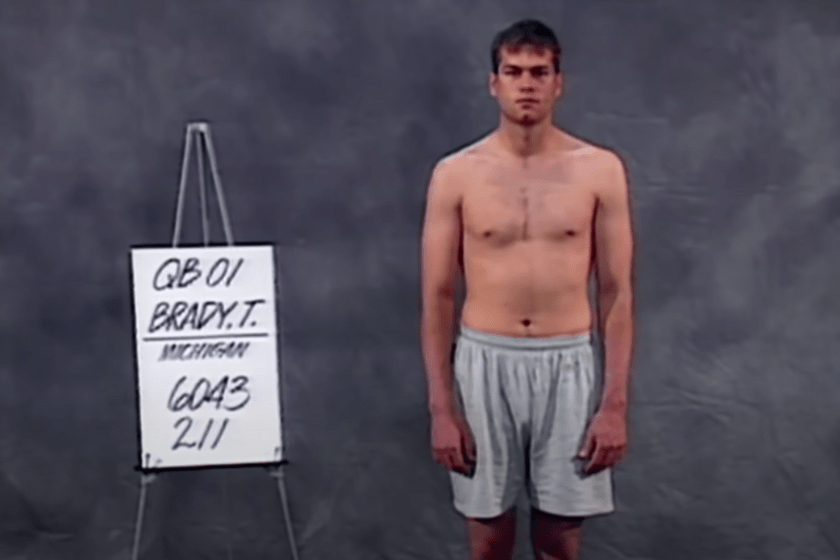
Compared to all quarterbacks who have been drafted since 2000, Brady's shuttle time was in the top 25%, his 3 cone time was in the top 50%, and his broad jump, vertical leap and 40 yard dash were all in the bottom 25%.
Changes in combine performance over time
Athlete performance has changed over time.
I've plotted average performance by year for each of the events. For the 40 yard dash, shuttle, and 3 cone drills, lower is better, and for the other events, higher is better.
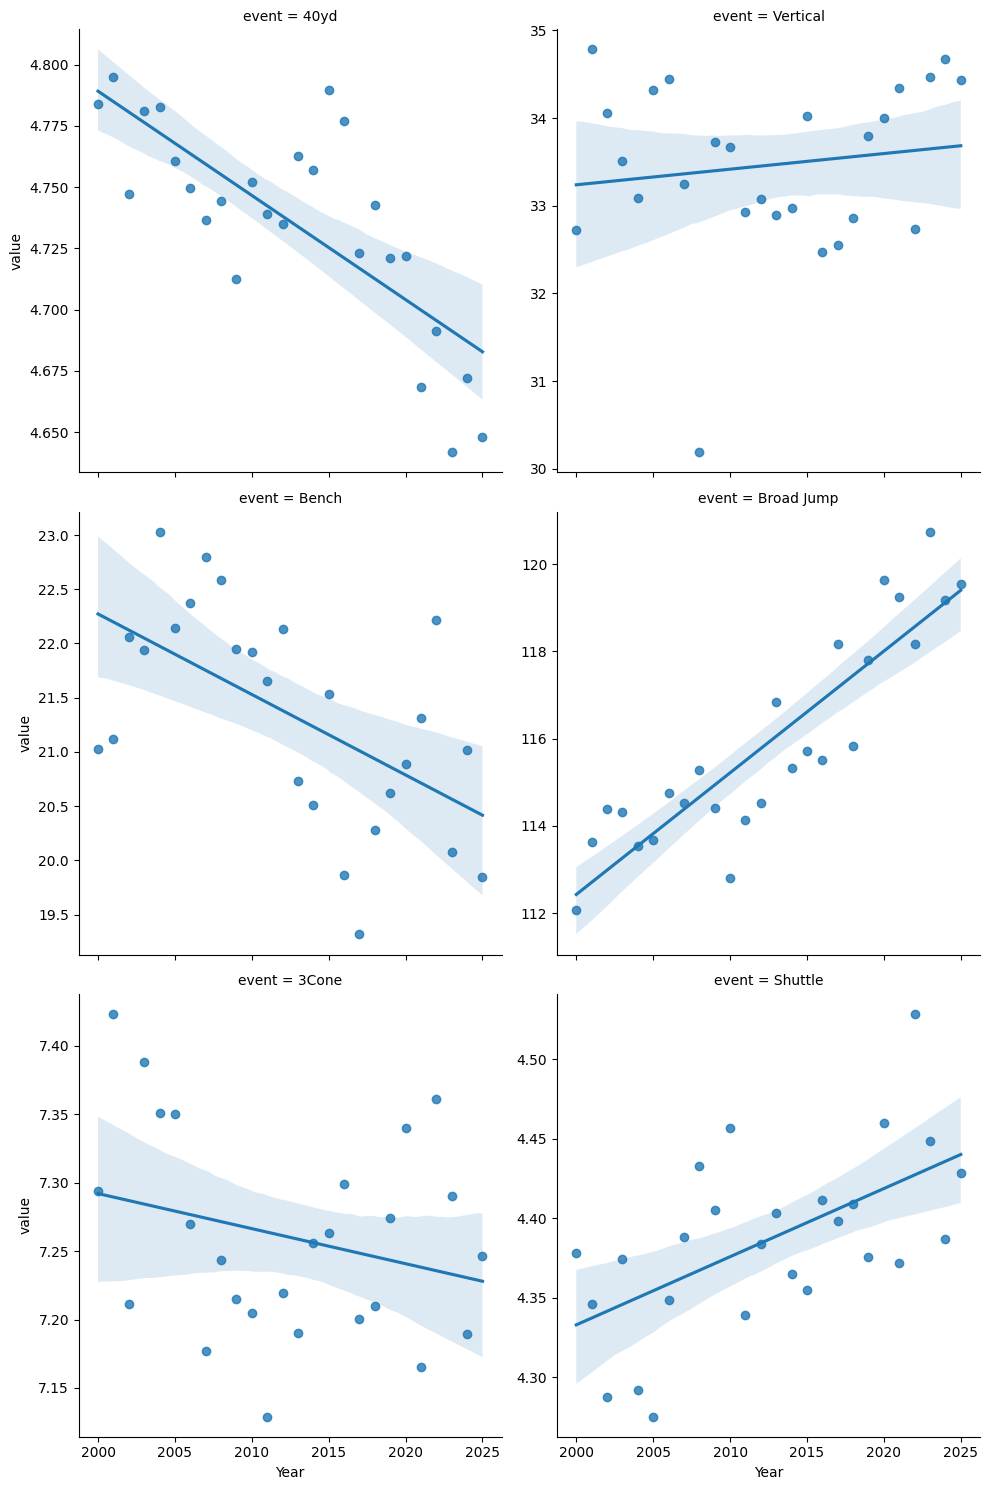
40 yard dash times and broad jump distances have clearly improved, whereas shuttle times and bench press reps have gotten slightly worse.
There's a cliche in sports that "you can't coach speed". While some people are innately faster than others, the 40 yard dash is partly a skill exercise -- learning to get off the block as quickly as possible without faulting, for starters. The high priority given to the 40 yard dash should lead to prospects practicing it more, and thus getting better numbers.
The bench press should be going down or staying level, since it's not very important to draft position.
There's been a significant improvement in the broad jump - about 7.5% over 25 years. As with the 40 yard dash, I'd guess it's better coaching and preparation. Perhaps it's easier to improve than some of the other events. I don't think there's more broad jumping in an NFL game than there was 25 years ago.
Shuttle times getting slightly worse is a little surprising. It's very similar to the 3 Cone drill, which has slightly improved. But as we saw, neither one is particularly important as far as draft position, and it's not a strong trend.
Caveats
Some of the best athletes skip the combine entirely, because their draft position is already secure. And some athletes will only choose to do the exercises they think they will do well at, and skip their weak events. This is known as MNAR data (missing, not at random). All analysis of MNAR data is potentially biased.
I'm assuming a linear relationship between draft position and performance. It's possible that a good performance helps more than a bad performance hurts, or vice versa.
I didn't calculate statistical significance for anything. Some correlations will occur even in random data. This isn't meant to be rigorous.