NFL point totals and money lines

Song: Sam and Dave, "Hold On, I'm Coming"
Code: https://github.com/csdurfee/scrape_yahoo_odds/blob/main/explore_football.ipynb
This week, more insights into NFL betting from BetMGM gambling data (harvested from Yahoo). I'm looking at the last 5 seasons of regular season NFL games (2021-2022 thru 2025-2026). There are 1,359 games total, around 140 of which are missing betting percentage data, so have been excluded from parts of this analysis.
Point totals
Gamblers can wager on whether the total number of points scored in an NFL game will be over or under a certain number. These bets are sometimes called over/unders.
Spreads are a wager on the difference in team scores, and point totals are a wager on the sum. It's kind of an odd bet, because it doesn't matter which team wins. All bets are math problems, but over/unders are more obviously so.
The over has won 48.4% of the time (658/1359 games). Point totals almost never push (hit the number exactly, meaning neither side wins). That's only happened in 12 of 1358 games. About 60% of point totals are on the half point (6.5 instead of 6, for example), so they can't push.
The win rate for overs has changed over the past 5 seasons. The over won about 46% of the time from 2021-23, and 53% of the time from 2024-25. That possibly mirrors what we saw last time -- it was wildly profitable to fade the public on spread bets from 2021-23, and wasn't the last two seasons. I don't have a good theory as to why the win percents mirror each other.
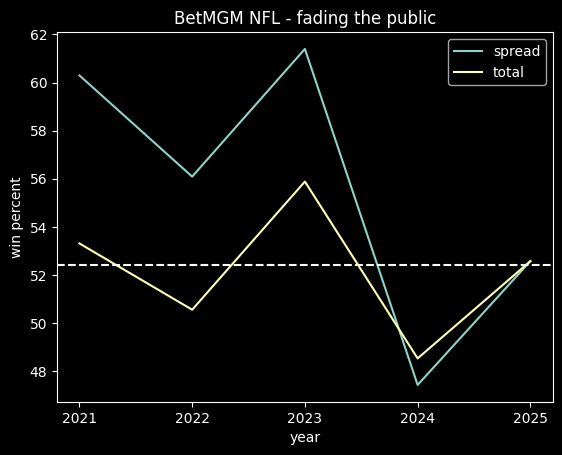
Taking the under is usually equivalent to fading the public, because as with the NBA, the betting public greatly prefers the over on point totals, taking them 86.8% (1056/1217) of the time. When the public takes the over, they win 48.1% of the time. On the rare occasions where they take the under, they win 46.6% of the time. So, this is yet another example of where gamblers as a whole do worse than a coin flip. In 3 of the 5 seasons, they did poorly enough that fading their picks would have been profitable.
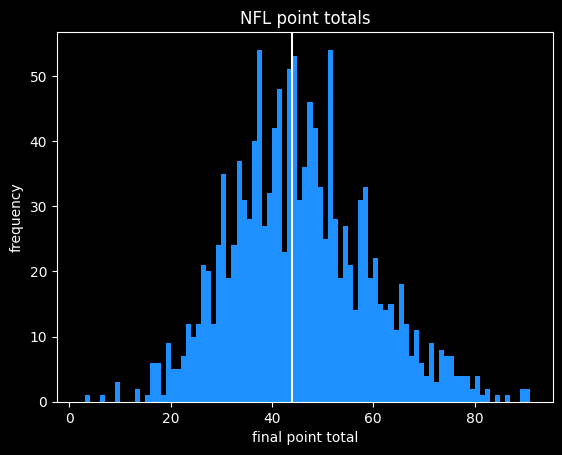
Half of all point total spreads are between 41.5 and 47.5, with the median being 44.5. A naive betting strategy would be to assume that low point totals are too low (always take the over if the total is less than 44.5), and high point totals are too high (take the under if the total is greater than or equal to 44.5). This strategy would've gone 700-658 (51.6%). It's not much, but there might be a slight advantage to betting on boring point total outcomes.
Here are the win rates for betting on the over, by point total range (split by quartiles):
| start (>) | end (<=) | over won | over lost | over win percent |
|---|---|---|---|---|
| 0 | 41.5 | 211 | 185 | 53.2% |
| 41.5 | 44.5 | 161 | 200 | 44.5% |
| 44.5 | 47.5 | 151 | 140 | 51.9% |
| 47.5 | max | 134 | 176 | 42.2% |
Some of the variation is just noise, but based on this breakdown, taking overs on high point totals seems like a bad move.
Here are what the actual point totals look like:
Point total errors
Here are what the errors against the point total look like. Positive values are games that went over the total, negative are games that went under.
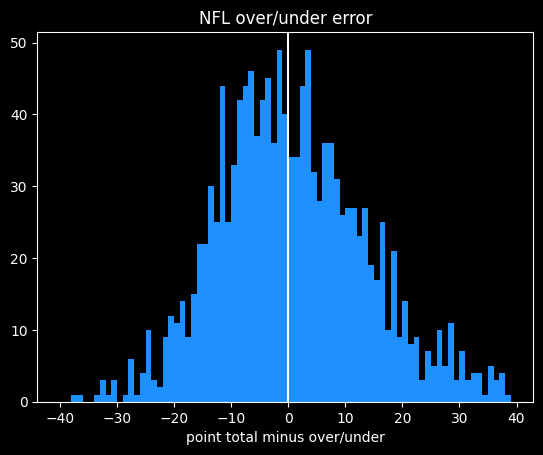
The median error is -0.5, so the errors are fairly balanced even if the graph isn't symmetrical. As with other NFL data, there are spikes because some point totals are more likely than others.
There's a longer tail to the positive side than the negative -- it's impossible to score fewer than 0 points, which limits how far under a bet can go, but there's theoretically no limit to how many points the teams can score in the over direction.
Here's how the total errors break down.
count    1358.000000
mean        0.767305
std        13.402751
min       -37.500000
25%        -8.500000
50%        -0.500000
75%         9.000000
max        57.500000
Point totals are off by an average of 10.6 points. Here are the details about the absolute value of the error:
count    1358.000000
mean       10.561119
std         8.282722
min         0.000000
25%         4.000000
50%         8.500000
75%        14.500000
max        57.500000
NFL money lines and the favorite-longshot bias
A money line bet is the simplest type of bet to understand, because it's a wager on who will win the game outright. A bet on the underdog will pay out more than you have to risk, because it's less likely to happen.
Money line data is always going to be high variance -- one +400 bet winning or not can wildly change the Expected Value. That was a problem with the NBA, which has 5x the games of the NFL, so it's definitely going to be a problem here.
The public's money line picks do better than their spread picks. They're making an average of -3.1% on money line bets, which is a step up from the -6.7% they're doing on the spread. That mirrors the NBA, where the public does significantly better on the money line than spread bets.
The public is also a slightly better Expected Value than taking money line bets randomly. The public are saved by their love of favorites, which they took in 96% (1181/1228) of games, and are a relatively good deal on the money line.
Each bet has two sides. Underdog money lines on NFL football are a bad bet in general (-7.3% EV), but huge underdogs are especially bad (-29.7% EV). This is evidence of the favorite-longshot bias in NFL betting. A -30% EV puts longshot underdog money lines in the same league as the biggest sucker bets you can take -- Same Game Parlays, 4+ leg parlays, and teasers.
"EV %" is the expected value of taking every bet in each category. Overall, money line bets have a -5.5% EV.
| label | start | end | num games | EV % |
|---|---|---|---|---|
| all favorites | -9999 | -1 | 1271 | -3.9% |
| mild favorites | -200 | -1 | 662 | -2.8% |
| heavy favorites | -400 | -200 | 406 | -7.5% |
| huge favorites | -9999 | -400 | 203 | -0.2% |
| ---------------- | ---- | ---- | ---- | ------ |
| all dogs | 1 | 9999 | 1185 | -7.3% |
| mild dogs | 1 | 200 | 663 | -5.4% |
| heavy dogs | 200 | 400 | 399 | -3.4% |
| huge dogs | 400 | 9999 | 123 | -29.7% |
| ---------------- | ---- | ---- | ---- | ------ |
| everythang | -9999 | 9999 | 2456 | -5.5% |
That -29.67% for huge dogs is hiding a big discrepancy. Huge home dogs (>= +400) have actually made money, winning 8/31 games. Huge away dogs have only won 6/92 games, for an absurd -63% Expected Value. The average odds for these bets is +600 (1 in 7 chance of winning), so we'd expect 13 of 92 bets to win, not 6.
Like I said at the top, money line dogs are going to be extremely variable, and the +400 number is a totally arbitrary cutoff. But even if huge away dogs had won twice as often, they'd still be unprofitable. Woof!
Money line favorites turn out to be a slightly better value than spread bets. But the estimated EVs are very sensitive to changes. I've been working on this project for a couple of weeks now, and noticed the numbers changing pretty significantly over the last 2 weeks of the NFL season. So the estimates are not telling the whole story about the range of possible outcomes.
Bootstrapping money lines
Since every bet has a different payout, they're not going to follow some nice, polite distribution. In order to estimate the variance in outcomes, I'm going to use bootstrapping, a popular technique in these parts.
I'm using the scikits-bootstrap library to generate a 90% confidence interval for the Expected Values. It samples random subsets of the bets in each category and calculates the EV of each subset. Then it returns the 5th and 95th percentile outcomes, which is a plausible range of values for the EV.
| label | start | end | num games | 5th %ile | EV | 95th %ile |
|---|---|---|---|---|---|---|
| all favorites | -9999 | -1 | 1271 | -7.2% | -3.9% | -0.6% |
| mild favorites | -200 | -1 | 662 | -8.3% | -2.8% | 2.4% |
| heavy favorites | -400 | -200 | 406 | -13.0% | -7.5% | -2.6% |
| huge favorites | -9999 | -400 | 203 | -5.3% | -0.2% | 4.0% |
| ---------------- | ---- | ---- | ---- | ------ | --- | ----- |
| all dogs | 1 | 9999 | 1185 | -14.0% | -7.3% | -0.2% |
| mild dogs | 1 | 200 | 663 | -12.6% | -5.4% | 2.3% |
| heavy dogs | 200 | 400 | 399 | -16.5% | -3.4% | 10.5% |
| huge dogs | 400 | 9999 | 123 | -55.3% | -29.7% | 4.7% |
| ---------------- | ---- | ---- | ---- | ------ | --- | ----- |
| everythang | -9999 | 9999 | 2456 | -9.1% | -5.5% | -1.7% |
Those are some pretty wide confidence intervals. Even the big categories like all favorites lead to a wide range of outcomes.
Even with the -29.7% EV for huge dogs, we can't rule out some small hope that somebody could make money taking them, I suppose. But as always, if there's randomness involved, we don't get to pick whether we get the 5th percentile result, the average result, or the 95th percentile result.
Mathletix Bajillion, playoffs round 2
After a dramatic 10-0 run by the Hand-Eggs, both teams are now in the black for the season.
Lines taken Wednesday morning
The Neil McAul-Stars
last week: 3-2, +88
Overall: 25-24-1, +3
line shopping: +143
- BUF +1 -101 (prophetx)
- SF +7 +104 (prophetx)
- NE -3 -109 (prophetx)
- CHI +4 -104 (prophetx)
The Vincent Hand-Eggs
last week: 5-0, +501
Overall: 25-22-3, +214
line shopping: +134
- NE -3 -109 (prophetx)
- SEA -7 -108 (prophetx)
- BUF +1.5 -107 (prophetx)
- LAR -3.5 -110 (prophetx)